Pi Network Open Mainnet Migration Status 2026
The Pi Network mainnet migration status 2026 shows that Pi Network has moved from a closed app-based phase into a live Open Mainnet environment. The firewall was removed on February 20, 2025, which allowed external connectivity and PI trading on selected exchanges.
This transition matters because not every app balance becomes usable PI automatically. Users must complete KYC, activate their Mainnet wallet, and finish migration before they can access transferable PI on-chain.
By June 2026, Pi Network claimed about 60 million registered Pioneers. Around 16 million users had completed KYC, and roughly 16 million had migrated to Mainnet. For holders, migration is the key step that turns eligible PI into a real blockchain asset.
| Milestone | Date | Details |
| Enclosed Mainnet launch | December 2021 | Internal mainnet, no external trading |
| Open Mainnet firewall removed | February 20, 2025 | PI begins trading on external exchanges |
| PI all-time high | February 26, 2025 | $2.99 per PI |
| Total Pioneers claimed | 2026 | ~60 million registered users |
| KYC-verified Pioneers | June 2026 | ~16 million completed |
| Mainnet-migrated Pioneers | June 2026 | ~16 million migrated |
| Protocol 23 activated | May 11, 2026 | Soroban smart contracts enabled |
| Pi DEX target launch | Q2–Q3 2026 | Peer-to-peer on-chain trading |
Mainnet Migration Update and Progress
The latest Pi Network mainnet migration update shows steady but still phased progress. By early 2026, more than 16 million Pioneers had migrated to Mainnet, while Pi Network reported about 16.5 million KYC-approved and migrated users around Pi Day 2026.
Pi Network also showed strong ecosystem activity. Its KYC system recorded 526,970,631 successful human validations by 1,094,680 validators. The first validator rewards snapshot included 16,568,774 PI in the pool, tied to migrated users, although Pi Network has not published one exact total for all migrated PI balances.
Understanding Pi Network KYC Requirements
Pi Network KYC is required for Mainnet migration because the network must confirm that each account belongs to a real person. This helps Pi Network reduce bots, duplicate accounts, fake balances, and abuse before PI moves to the public blockchain.
KYC also protects the migration process. Only verified users can transfer eligible PI from the mobile app balance to the Mainnet wallet. Without approved KYC, a user may still see PI in the app, but they cannot fully access migrated PI on-chain.
Pi Network supports identity checks through the Pi app and Pi Browser. In 2026, the project also expanded verification with palm print technology. This method adds another human verification layer and helps confirm that one person controls one account.
KYC Status and Open Mainnet Access
The Pi Network KYC status and Open Mainnet 2026 process directly affect migration eligibility. If KYC shows as approved, the user can continue through the Mainnet Checklist and prepare the wallet for migration.
Users can check their status inside the Pi app or through the Pi Browser. Delays may happen because of unclear documents, name mismatches, regional queues, or extra verification steps. To resolve issues, users should review their KYC details, follow app prompts, and wait for official updates.
Step-by-Step Mainnet Migration Process
The Pi Network mainnet migration process is simple when you follow each step in the correct order. Beginners should not rush this process because wallet setup, KYC, and lockup choices affect access to migrated PI.
- Check your eligibility in the Pi app: Open the Mainnet section and review your Mainnet Checklist. The app shows which steps are complete and which still need action.
- Complete KYC verification: Pi Network must approve your identity before you can migrate eligible PI to Mainnet. If KYC is still pending, migration cannot move forward.
- Create and confirm your Mainnet wallet: Open Pi Browser, create your wallet, save the passphrase, and confirm the wallet address inside the Pi app.
- Set your lockup configuration: Choose how much PI you want to lock and for how long. A lockup can improve your mining rate, but it also limits immediate access to that PI.
- Complete the final migration confirmation: After all checklist steps are complete, confirm migration and wait for Pi Network to transfer eligible PI to your Mainnet wallet.
- Verify your balance after migration: Open your Mainnet wallet and check available, locked, and migrated PI. If your balance does not appear yet, your transfer may still be processing.
Mainnet Checklist Steps for Migration
The Pi Network mainnet checklist steps show every action required before migration. Users should complete them carefully because missing one step can delay access to Mainnet PI.
- Complete KYC verification inside the Pi app.
- Create your Mainnet wallet through Pi Browser.
- Save your wallet passphrase in a secure offline place.
- Confirm your wallet address in the Mainnet Checklist.
- Complete or review your Security Circle.
- Choose your lockup percentage and lockup duration.
- Accept the Mainnet token terms.
- Complete any required 2FA verification.
- Confirm the final migration step.
- Check your Mainnet wallet after migration.
Mainnet Wallet Activation Feature
The Pi Network mainnet wallet activation feature helps users create a wallet that receives migrated PI. You can activate it through Pi Browser.
- Open Pi Browser from the Pi app.
- Go to the wallet section.
- Create your Mainnet wallet.
- Copy and safely store your passphrase.
- Return to the Pi app.
- Confirm your wallet address in the Mainnet Checklist.
- Check whether the wallet activation step shows as complete.
Your passphrase controls access to your wallet. Never share it with anyone, and do not store it in places that other people can access.
Pi Network Mainnet Withdrawals
Pi Network mainnet withdrawals become possible only after migration. This means your PI must first move from the Pi app balance to your Mainnet wallet. Until then, you may see PI in the app, but you cannot send it like a normal on-chain asset.
After migration, users can transfer available PI to another Pi Network wallet, a supported external wallet, or an exchange that accepts native Mainnet PI. However, locked PI cannot be withdrawn until the lockup period ends. Users must also check wallet addresses carefully because blockchain transfers cannot be reversed.
Mainnet Withdrawal Process Explained
The Pi Network mainnet withdrawal process starts inside your Mainnet wallet. First, open Pi Browser, go to the wallet, and check whether your PI shows as available instead of locked.
- Copy the correct recipient address.
- Paste it into your Pi Network wallet.
- Enter the amount of PI you want to send.
- Review the address, fee, and amount.
- Confirm the transaction.
- Wait for blockchain confirmation.
- Check the receiving wallet or exchange balance.
Before sending PI to an exchange, confirm that the platform supports native Mainnet PI, not only IOU trading. Always test with a small amount first.
Trading Pi on Exchanges After Mainnet
The Pi Network mainnet exchange listing status changed after Open Mainnet allowed external connectivity. Users can now trade PI on selected platforms that support real Mainnet deposits and withdrawals. However, beginners must check each platform carefully before sending funds.
StealthEX gives users another way to exchange PI without creating a trading account. It works as a non-custodial swap service, so users send PI from their wallet and receive another crypto asset in their chosen wallet.
This setup can suit users who prefer simple swaps, direct wallet-to-wallet transfers, and no standard account registration. Still, users must first complete Pi Network KYC, migrate PI to Mainnet, and send only unlocked native PI.
IOU vs Native PI: What to Know Before Trading
IOU PI tokens are synthetic exchange balances that traded before full Open Mainnet access. They do not always represent real PI that users can withdraw to a Pi Network wallet.
Native Mainnet PI works differently. It is a real on-chain PI stored in a verified Mainnet wallet after KYC and migration. Users should always check whether an exchange supports IOU PI or native PI. Historical IOU and native PI prices have differed, while StealthEX exchanges only native Mainnet PI.
| Feature | IOU PI Token | Native Mainnet PI |
| What it is | Synthetic representation of PI on the exchange | Real PI migrated to the Mainnet blockchain |
| Requires KYC? | No | Yes — mandatory |
| Requires Mainnet migration? | No | Yes |
| Backed by a real PI? | Not always — depends on exchange | Yes, 1:1 on-chain |
| Price accuracy | May differ from the real PI market price | Reflects true market value |
| Can it be withdrawn to the Pi wallet? | No | Yes |
| Available on StealthEX? | No — StealthEX lists native PI only | Yes |
Open Mainnet Exchange Listing Status
The Pi Network open mainnet exchange listing market now includes several centralized exchanges and swap platforms. PI trades mainly against USDT, although some venues also support USD pairs. CoinGecko shows Gate as one of the most active PI markets, with OKX and Bitget also listed as popular options. Binance still marks Pi Network as “Not listed,” while Coinbase shows Pi Network as not tradable. Kraken now shows PI trading support, so users should always verify deposits, withdrawals, and native Mainnet support before moving funds.
| Exchange | PI Listed | Trading Pairs | Native PI | Notes |
| OKX | Yes | PI/USDT | Yes | One of the earliest listings |
| Bitget | Yes | PI/USDT | Yes | Active spot market |
| Gate.io | Yes | PI/USDT | Yes | One of the most active PI markets |
| MEXC | Yes | PI/USDT | Yes | Active trading |
| HTX | Yes | PI/USDT | Yes | Available on selected markets |
| Bitfinex | Yes | PI/USD, PI/USDT | Yes | USD and USDT pairs |
| StealthEX | Yes | PI ↔ 2000+ coins | Yes | No-KYC, non-custodial swaps |
| Binance | No | — | — | Not listed as of July 2026 |
| Coinbase | No | — | — | Not tradable as of July 2026 |
| Kraken | Yes | PI/USD | Yes | Spot trading support shown |
Pi Network Mainnet Price Today
The Pi Network mainnet price today sits near the $0.11–$0.12 range across major trackers, but prices can differ slightly by exchange. Kraken shows PI around $0.12, while MEXC reports a 24-hour range near $0.1135–$0.1174. CoinGecko shows daily PI volume above $8 million.
Troubleshooting Migration Issues
If you see Pi Network tokens missing Mainnet migration, first check whether your PI is available, locked, or still pending inside the Mainnet wallet. Some balances do not appear instantly because migration happens in batches, not all at once.
If KYC was rejected, review your name, ID document, photo quality, and app prompts. Submit corrections only through official Pi Network tools. If your migrated balance looks wrong, compare your transferable balance, lockup settings, and Security Circle rewards.
Never share your passphrase with anyone who claims they can “fix” migration. Use only the Pi app, Pi Browser, and official support channels.
Mainnet Migration Delay Reasons
The most common Pi Network mainnet migration delay reasons include KYC queues, technical checks, account review, missing checklist steps, and extra verification requests. Some users also wait longer because their region has more pending validations.
A delay does not always mean something is wrong. First, check your Mainnet Checklist, wallet confirmation, KYC status, and 2FA status. Then wait for the next migration batch. If the app asks for action, follow only official instructions.
Pi Network Development Roadmap and Timeline
The Pi roadmap now focuses on turning Pi Network from a mining app into a wider utility ecosystem. After Open Mainnet, the Pi Core Team moved attention toward protocol upgrades, app growth, Mainnet payments, token tools, and stronger developer support.
Future plans include more ecosystem utilities, broader wallet use, improved node performance, and governance features that can give Pioneers a clearer role in network decisions. The long-term vision is simple: Pi Network wants real people to use PI inside apps, commerce, DeFi tools, and AI-era products instead of treating the coin only as a speculative asset.
Mainnet Timeline and Future Updates
The Pi Network mainnet timeline started with Beta in 2019, Testnet in 2020, and Enclosed Mainnet in December 2021. Open Mainnet followed on February 20, 2025, when the firewall was removed.
In 2026, Pi Network added stronger KYC tools, Launchpad testing, Protocol 23, and more smart contract preparation. Future updates should focus on Mainnet app launches, ecosystem token tools, governance, Pi DEX, and better developer infrastructure.
Protocol 23 & Smart Contracts
Stellar Protocol 23 was activated on Pi Network Mainnet on May 11, 2026. It was the largest technical upgrade since Open Mainnet because it brought Soroban smart contracts to Pi Network.
This upgrade enables DeFi apps, Pi Launchpad projects, and the planned Pi DEX. It also moves Pi Network from a payment-focused blockchain toward a programmable blockchain. This connects with the Pi Core Team’s AI-era vision, where verified humans can power real utility. Pi DEX aims to support peer-to-peer PI trading without centralized exchanges.
Frequently Asked Questions
What Is the Mainnet Migration Guide for Pi Network?
The Pi Network mainnet migration guide explains how to complete KYC, activate the Mainnet wallet, confirm lockup settings, and transfer eligible PI. Users can find official steps inside the Pi app.
How Do I Withdraw Pi Coins from Mainnet?
To use Pi Network withdraw PI coins Mainnet features, open your Mainnet wallet, enter a supported wallet or exchange address, review the transaction, and confirm it. Always test with a small amount first.
What Is Pi Network’s Open Mainnet Price Prediction?
A Pi Network open mainnet price prediction depends on exchange liquidity, user migration, ecosystem growth, token unlocks, and market sentiment. Any PI forecast remains speculative because crypto prices can change fast.
What Are the Mainnet Migration Steps?
The Pi Network mainnet migration steps include completing KYC, activating your wallet, confirming your wallet address, choosing lockup settings, approving migration, and checking your Mainnet balance.
Follow us on Medium, X, Telegram, YouTube, and Publish0x to stay updated about the latest news on StealthEX.io and the rest of the crypto world.
Don’t forget to do your research before buying any crypto. The views and opinions expressed in this article are solely those of the author.
blockchain blockchain technology crypto world cryptocurrency KYCThe post Pi Network Open Mainnet & KYC: Complete Migration Guide 2026 first appeared on StealthEX.]]>
Can Bitcoin Make You a Millionaire Today?
Bitcoin can make someone a millionaire, but it usually requires either a large starting investment, a very low entry price, or many years of strong price growth. Today, Bitcoin already trades at a high market value, so the easiest gains from the early years no longer exist. That does not mean the opportunity has disappeared. It means beginners need realistic expectations.
If someone buys a small amount of BTC today, they should not expect it to turn into $1 million quickly. For example, a $500 or $1,000 investment would need an extreme price increase to reach millionaire status. However, a person who already owns several BTC could reach that level if Bitcoin rises sharply in the future. So, can Bitcoin make you a millionaire? Yes, but not in a guaranteed or simple way. The final result depends on your BTC amount, your buying price, market cycles, and how well you manage investment risk.
How Much Bitcoin Is Needed to Reach $1 Million?
The amount of Bitcoin needed to become a millionaire changes with the Bitcoin price. The calculation is simple: divide $1 million by the price of one BTC. If Bitcoin trades near $62,800, you would need about 15.92 BTC to reach $1 million in value. If Bitcoin rises to $100,000, you would need 10 BTC. If it reaches $250,000, you would need 4 BTC. At $500,000, you would need 2 BTC. If Bitcoin ever reaches $1 million per coin, then 1 BTC would make you a millionaire before taxes, fees, or selling costs.
This is why the question “how much bitcoin needed to be a millionaire” has no fixed answer. It depends on the future price and the amount you hold. Beginners should also remember that portfolio value changes every day. Bitcoin can rise fast, but it can also fall hard. Because of that, the goal should not focus only on the final number. It should also include risk, patience, and a clear plan.
Bitcoin Price Scenarios for Becoming a Millionaire
Bitcoin price scenarios help show why BTC ownership matters as much as the market price. The higher Bitcoin climbs, the less BTC someone needs to hold $1 million in value. However, every price target carries different levels of risk and uncertainty. A move to $100,000 would still require a large amount of capital for most beginners. A move to $250,000 would make the goal easier for people with several BTC, but it would still not turn very small holdings into life-changing wealth. The famous Bitcoin $1 million scenario changes the math completely because one full BTC would equal $1 million before taxes and fees.
These examples do not predict the future. They simply show how the calculation works. Bitcoin can move through powerful bull markets, but it can also lose value during long downturns. That is why beginners should treat every scenario as a planning tool, not a promise.
| Bitcoin Price | BTC Needed for $1 Million | What It Means |
| $100,000 | 10 BTC | Requires a very large holding |
| $250,000 | 4 BTC | Still difficult for most beginners |
| $500,000 | 2 BTC | Possible only with strong long-term growth |
| $1,000,000 | 1 BTC | One full BTC reaches millionaire value |
Can 1 Bitcoin Make You a Millionaire?
Yes, 1 Bitcoin can make you a millionaire if Bitcoin reaches $1 million per coin. This idea may sound extreme, but some well-known Bitcoin supporters have made similar forecasts. Cathie Wood from ARK has discussed a path toward Bitcoin near $1 million by 2030, while Michael Saylor has argued that BTC could reach $1 million within a longer time frame.
Still, beginners should treat these predictions as opinions, not guarantees. Bitcoin would need massive demand from investors, companies, funds, and possibly governments to reach that level. So, can 1 Bitcoin make you a millionaire? Yes, but only if the market grows far beyond today’s size. Until then, 1 BTC remains a powerful holding, but not a guaranteed ticket to $1 million.
How Much Would You Need to Invest in Bitcoin?
The amount you need to invest in Bitcoin depends on three things: the current BTC price, the amount of BTC you want to own, and your future price target. Bitcoin is divisible, so you do not need to buy a full coin. You can own a fraction of BTC, and the smallest unit is called a satoshi. This makes Bitcoin more accessible because a beginner can start with a small amount instead of trying to buy 1 BTC at once.
However, each platform can set its own minimum order size. For example, Kraken says a standard BTC trade must be at least 0.0001 BTC, while its instant buy option starts from 1 USD, EUR, GBP, CAD, CHF, or AUD. Card purchases on Kraken start from 10 USD or 10 EUR.
So, when someone asks “how much bitcoin should I buy,” the better question is: how much can you invest without damaging your budget?
Example Investment Scenarios
Small Bitcoin investments can grow if the BTC price rises, but the final value depends on the amount you buy. For example, someone who buys $100 of Bitcoin owns only a small fraction of BTC. If Bitcoin doubles, that investment becomes about $200 before fees and taxes. If Bitcoin grows 10 times, it becomes about $1,000. That is a strong return, but it does not create a millionaire.
Larger investments change the math, although they also increase investment risk. A person who buys $10,000 worth of BTC has a much better chance of reaching a large portfolio value if Bitcoin enters a major bull market. Still, the result depends on the entry price and the future BTC price.
| Investment Size | If Bitcoin 2x | If Bitcoin 5x | If Bitcoin 10x |
| $100 | $200 | $500 | $1,000 |
| $1,000 | $2,000 | $5,000 | $10,000 |
| $10,000 | $20,000 | $50,000 | $100,000 |
These examples show a simple truth: small amounts can grow, but millionaire results usually require larger capital, more BTC, or much higher Bitcoin prices.
Why Bitcoin Entry Price Matters
Your entry price matters because it decides how much BTC you receive for the same amount of money. If you invest $1,000 when Bitcoin costs $50,000, you get 0.02 BTC. If you invest the same $1,000 when Bitcoin costs $100,000, you get only 0.01 BTC. The difference may look small, but it becomes important if Bitcoin reaches much higher prices later.
This is why many investors use dollar-cost averaging instead of trying to buy the perfect dip. They buy smaller amounts over time, so they reduce the risk of entering the market at one unlucky moment. However, no method removes Bitcoin volatility. A lower entry price can improve your upside, but a clear budget protects you from investing more than you can afford to lose.
Could 0.1 BTC or 0.01 BTC Make You a Millionaire?
A small Bitcoin holding can become valuable, but the millionaire math gets difficult very quickly. If you own 0.1 BTC, Bitcoin would need to reach $10 million per coin for your holding to equal $1 million before taxes and fees. This is why the phrase 0.1 Bitcoin millionaire describes a very ambitious scenario, not a realistic short-term expectation. It would require Bitcoin to grow far beyond even the most popular long-term price targets.
The situation looks even harder with 0.01 BTC. In that case, Bitcoin would need to reach $100 million per coin for the holding to be worth $1 million. That does not mean small BTC amounts have no value. They can still help beginners build exposure, learn how Bitcoin works, and grow wealth over time if the market rises. However, 0.1 BTC and 0.01 BTC should not create false expectations. These amounts may become meaningful savings, but they would need extreme price growth to create a millionaire result on their own.
How to Become a Bitcoin Millionaire Responsibly
The responsible way to chase a Bitcoin millionaire goal starts with a plan, not emotion. Bitcoin can rise fast, but it can also fall sharply, so beginners should never treat it like a guaranteed path to wealth. A smart approach begins with a personal budget. You need to know how much money you can invest without touching rent, bills, savings, emergency funds, or debt payments.
The next step is choosing a clear strategy. Some people buy once and hold it for years. Others use dollar-cost averaging, which means they invest smaller amounts on a regular schedule. This method can reduce stress because you do not need to guess the perfect buying moment. It also helps you build a BTC position over time.
Security matters as much as profit. If you want to know how to become a bitcoin millionaire, you also need to know how to protect your coins. Use strong passwords, enable two-factor authentication, and learn the difference between keeping BTC on an exchange and storing it in a private wallet. Owning Bitcoin also means taking responsibility for access and safety.
Finally, keep expectations realistic. Bitcoin may create large returns, but every investment carries risk. The goal should not be to get rich overnight. The better goal is to build knowledge, manage risk, and make decisions that still make sense if the market moves against you.
Long-Term Holding and Dollar-Cost Averaging
Many investors who ask how to become a millionaire with Bitcoin focus on long-term holding because BTC has moved through several major market cycles. The idea is simple: you buy Bitcoin, keep it through ups and downs, and wait for the market to grow over time. However, holding requires patience because Bitcoin can fall hard during bear markets.
Dollar-cost averaging can make this process easier for beginners. Instead of investing one large amount at once, you buy smaller amounts on a regular schedule, such as weekly or monthly. This approach helps you avoid the stress of guessing the perfect entry price. It also builds discipline. Dollar-cost averaging does not remove risk, but it can make Bitcoin investing more manageable and less emotional.
Risk Management and Secure Storage
Risk management starts before you buy Bitcoin. You should decide how much money you can invest without hurting your daily life, your emergency savings, or your long-term financial stability. Bitcoin volatility can create large gains, but it can also cut portfolio value quickly. For this reason, beginners should avoid borrowing money, using high leverage, or investing cash they may need soon.
Crypto wallet security also plays a major role. If you keep Bitcoin on an exchange, you depend on that platform. If you use a private wallet, you control your coins, but you must protect your seed phrase. Store it offline, never share it, and never type it into random websites. A strong Bitcoin plan protects both your money and your access to it.
What Could Stop Bitcoin From Making You a Millionaire?
Bitcoin can create large returns, but several things can stop it from turning an investor into a millionaire. The first risk is price movement. Bitcoin does not rise in a straight line. It can grow quickly during a bull market, then lose a large part of its value during a bear market. A person who buys near the top may need years to recover.
The second risk is unrealistic expectations. Many beginners ask, “Will Bitcoin make me a millionaire?” but the answer depends on the amount of BTC they own, their entry price, and future market demand. A small investment cannot easily become $1 million unless Bitcoin reaches an extremely high price.
Regulation can also affect the market. New rules for exchanges, taxes, stablecoins, custody, or institutional access may change how easily people buy and hold BTC. Security creates another major risk. If someone loses a seed phrase, sends BTC to the wrong address, or falls for a scam, they may lose access forever.
That is why Bitcoin needs more than belief. A realistic plan must include risk, security, patience, and clear investment limits.
Volatility, Regulation, and Market Cycles
Bitcoin volatility can make the road to millionaire status difficult. BTC may rise quickly when demand grows, but it can also drop sharply when fear returns to the market. These swings often follow market cycles. During bull markets, investors become more confident and prices can climb fast. During bear markets, weak demand and panic selling can push prices much lower.
Regulation adds another layer of uncertainty. Clear rules can help Bitcoin grow because large investors may feel safer entering the market. However, strict rules, tax changes, or limits on crypto platforms can reduce demand in some regions. For beginners, this means one thing: Bitcoin can offer upside, but the path will likely include strong corrections and stressful periods.
Personal Budget and Investment Limits
Your personal budget matters more than any Bitcoin price prediction. Even if you believe BTC can grow for many years, you should not invest money that you need for rent, food, debt, insurance, or emergency savings. A bad budget can turn normal market volatility into real financial pressure.
The safest approach is to set a fixed investment limit before buying. That limit should match your income, expenses, and risk tolerance. If Bitcoin falls, you should still be able to live normally. No millionaire goal is worth damaging your financial security today. Bitcoin can become part of a long-term plan, but it should not replace basic money management.\
Is Becoming a Bitcoin Millionaire by 2030 Realistic?
Becoming a Bitcoin millionaire by 2030 is possible, but it depends on how much BTC someone owns today. At a Bitcoin price near $62,850, a person would need about 15.9 BTC to hold $1 million in value right now. If Bitcoin reached $250,000 by 2030, that person would need 4 BTC. If BTC reached $500,000, they would need 2 BTC. If Bitcoin reached $1 million, then 1 BTC would be enough.
Some bullish forecasts support the idea of a much higher BTC price. ARK Invest published 2030 Bitcoin scenarios of about $300,000 in a bear case, $710,000 in a base case, and $1.5 million in a bull case. Still, these are projections, not promises. So, when beginners ask how much Bitcoin to be a millionaire by 2030, the honest answer is simple: the goal looks more realistic for people who already hold at least 1–4 BTC, while smaller holdings would need an extremely strong bull market.
FAQ
How Much Bitcoin Do I Need to Be a Millionaire?
The amount changes with the Bitcoin price. If BTC costs $100,000, you need 10 BTC to reach $1 million. If BTC reaches $500,000, you need 2 BTC. If Bitcoin reaches $1 million, you need 1 BTC. So, how much Bitcoin do I need to be a millionaire depends on the future market price.
How Many Bitcoin Do You Need to Become a Millionaire?
The answer depends on your price target. At $250,000 per BTC, you need 4 BTC. At $500,000 per BTC, you need 2 BTC. At $1 million per BTC, one full Bitcoin would make your holding worth $1 million before taxes, exchange fees, or selling costs.
Can I Become a Millionaire With Bitcoin?
Yes, you can become a millionaire with Bitcoin, but it is not guaranteed. The result depends on how much BTC you own, your entry price, your holding period, and future demand. Beginners should treat Bitcoin as a high-risk investment, not a certain shortcut to wealth.
Can You Become a Millionaire From Bitcoin?
Yes, some investors can become millionaires from Bitcoin if they buy enough BTC and the price rises strongly over time. However, small investments need extreme growth to reach $1 million. Bitcoin can create big gains, but it also carries serious investment risk.
Has Anyone Become a Millionaire From Bitcoin?
Yes, many early Bitcoin investors became millionaires because they bought BTC when the price was much lower. Some miners, long-term holders, and early adopters gained life-changing wealth. However, today’s market is larger and more mature, so repeating those early returns is much harder.
How Much Bitcoin Should I Buy?
There is no single correct answer to “how much Bitcoin should I buy.” It depends on your income, savings, debt, risk tolerance, and long-term goals. A beginner should only invest money they can afford to lose. For many people, a small regular purchase through dollar-cost averaging works better than one emotional large buy.
Follow us on Medium, X, Telegram, YouTube, and Publish0x to stay updated about the latest news on StealthEX and the rest of the crypto world.
Don’t forget to do your own research before buying any crypto. The views and opinions expressed in this article are solely those of the author.
Bitcoin Bitcoin BTC Bitcoin price prediction BTC price prediction price analysisThe post How Much Bitcoin Do You Need to Become a Millionaire? first appeared on StealthEX.]]>
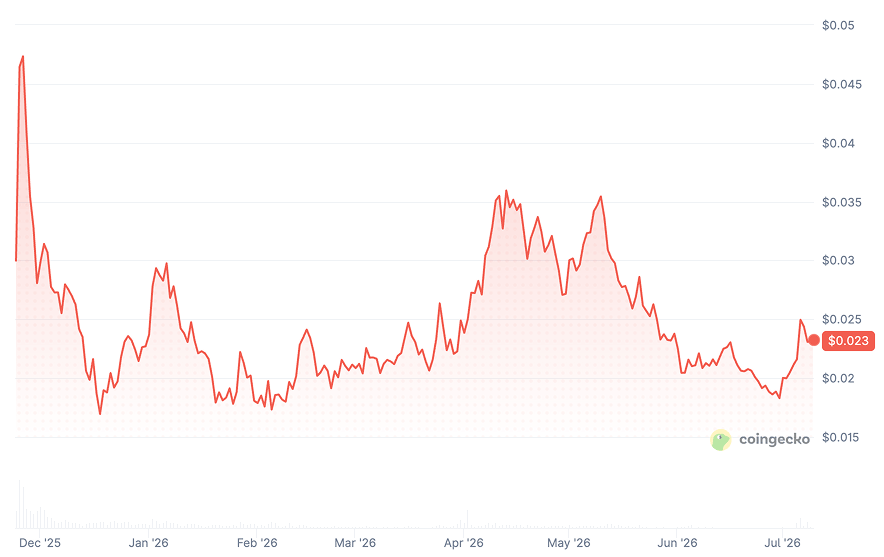
CoinGecko, July 9, 2026
Such price swings often appear in early-stage blockchain ecosystems. They reflect both hype and uncertainty. Investors now ask whether Monad can stabilize and grow. Others question if the rally already peaked. These debates shape current sentiment around MON.
This article examines Monad from multiple angles. We review the project’s structure and purpose. We analyze historical price action. We explore long-term forecasts through 2050. We also study expert opinions and technical signals. In addition, we explain what factors move the MON price.
The goal is not prediction certainty. Crypto markets remain unpredictable. However, structured analysis improves decision-making. Understanding context matters more than chasing hype. MON may represent opportunity, risk, or both depending on timing.
| Current MON Price | MON Price Prediction 2026 | MON Price Prediction 2030 |
| $0.023 | $0.03 | $0.06 |
Monad (MON) Overview
Monad is a high-performance Layer 1 blockchain launched on November 24, 2025. The network targets Ethereum’s biggest limits, which include slow throughput and expensive gas fees. Monad remains 100% EVM compatible, so developers can migrate Ethereum applications without rewriting code. This compatibility removes friction and accelerates ecosystem growth.
Performance defines Monad’s identity. The chain targets 10,000 transactions per second. Block finality reaches about 0.8 seconds. Average gas fees stay near $0.001 per transaction. By comparison, Ethereum transactions often cost between $0.50 and several dollars. This efficiency opens doors for payments, gaming, and high-frequency decentralized finance.
MON Price Statistics
| Current Price | $0.023 |
| Market Cap | $275,456,601 |
| Volume (24h) | $46,831,116 |
| Market Rank | #106 |
| Circulating Supply | 11,825,165,000 MON |
| Total Supply | 100,682,925,000 MON |
| 1 Month High / Low | $0.026 / $0.018 |
| All-Time High | $0.04876 Nov 26, 2025 |
Monad Labs formed in April 2022. Three former Jump Trading engineers founded the company. Keone Hon serves as CEO and previously led high-frequency trading systems at Jump. James Hansaker acts as CTO and built ultra-low-latency trading infrastructure. Eunice Giarta brings experience from BofA Merrill Lynch and Broadway Technology. The broader team includes over twenty engineers from Jump Crypto and other elite research firms. The group spent more than two years refining the protocol before launch.
The project follows a mission built on three pillars. First, it delivers a smooth developer experience through Ethereum compatibility. Second, it expands into global markets, especially regions with limited banking access. Third, it pursues cutting-edge performance without sacrificing decentralization. The long-term vision centers on powering a global, online-first economy through accessible financial infrastructure.
Monad achieves its speed through several architectural innovations. Parallel execution analyzes transaction dependencies and processes many at once. Superscalar pipelining divides work into stages and runs them simultaneously. Asynchronous input and output prevents data bottlenecks. MonadBFT consensus optimizes HotStuff to deliver fast finality with over 200 validators. MonadDB stores most state data on SSD rather than RAM, which lowers hardware costs and supports decentralization. RaptorCast and a local mempool improve block propagation and bandwidth efficiency.
The project raised roughly $432 million in funding. Investors include Paradigm, Dragonfly Capital, Electric Capital, Greenoaks, Coinbase Ventures, and Galaxy. This capital supports ecosystem growth and long-term research.
Monad Price Prediction: 2026, 2027, 2030-2050
| Year | Minimum Price | Maximum Price | Average Price | Price Change |
| 2026 | $0.016 | $0.0448 | $0.03 | +30% |
| 2027 | $0.0184 | $0.0546 | $0.035 | +50% |
| 2030 | $0.03 | $0.09 | $0.06 | +160% |
| 2040 | $0.072 | $0.1234 | $0.1 | +335% |
| 2050 | $0.1 | $0.3366 | $0.2 | +770% |
Monad Price Prediction 2026
DigitalCoinPrice analysts estimate that in 2026, Monad may trade between $0.0239 (+5%) at the lower end and $0.0448 (+95%) at peak valuation. Their outlook assumes gradual ecosystem traction and recovery from earlier volatility.
According to Coincodex, MON is expected to stay in a tighter range. Their models forecast a minimum price of $0.01603 (-30%), with a potential high of $0.02336 (+1%).
LBank presents a more conservative scenario. Their 2026 estimate places Monad around $0.02 (-15%), reflecting a slow accumulation phase rather than a breakout year.
Monad Price Prediction 2027
DigitalCoinPrice expects Monad to extend its climb in 2027, projecting a range between $0.0356 (+55%) and $0.0546 (+135%), supported by rising market confidence.
Coincodex aligns with the bullish direction. Their forecast suggests a floor of $0.01835 (-20%) and a ceiling of $0.06414 (+180%), pointing to accelerating adoption.
LBank remains cautious. Their 2027 model targets roughly $0.03 (+30%), implying gradual structural growth.
Monad Price Prediction 2030
By 2030, DigitalCoinPrice analysts believe MON could trade between $0.0463 (+100%) and $0.0566 (+145%), driven by expanding network activity.
Coincodex sees much stronger momentum. Their projections indicate a minimum of $0.03 (+30%) and a maximum of $0.09(+290%), assuming Monad evolves into a major infrastructure asset.
LBank’s long-term estimate suggests a modest level near $0.03 (+30%), reflecting a conservative adoption curve.
Monad Price Prediction 2040
Coincodex’s ultra-bullish 2040 scenario places Monad is between $0.089 (+285%) and $0.1234 (+435%), reflecting expectations of massive long-term ecosystem expansion.
DigitalCoinPrice offers a much more conservative view. Their 2040 forecast is between $0.0721 (+215%) and $0.0767 (+235%), suggesting gradual growth rather than explosive dominance.
Monad Price Prediction 2050
Looking further ahead, Coincodex estimates that MON could trade between $0.2364 (+930%) and $0.3366 (+1,365%) by 2050 if adoption compounds over decades.
DigitalCoinPrice’s long-term model suggests a smaller but still notable range between $0.1 (+335%) and $0.11 (+380%), reflecting a cautious outlook shaped by market cycles.
MON Price Prediction: What Do Experts Say?
Expert opinion around Monad remains sharply divided after the mainnet launch. Institutional participation created strong visibility, yet analysts disagree on whether that momentum can convert into sustainable price growth. Most projections for 2026 cluster between cautious optimism and structural skepticism. Targets range widely from modest recovery scenarios to aggressive breakout expectations.
Blockchainreporter outlines a constructive base case that places MON between $0.12 and $0.18 in 2026. Their thesis assumes steady developer migration, expanding DeFi activity, and rising transaction volume. In their framework, a 5–6× increase from the $0.025 public sale price represents a realistic outcome for a Layer 1 network that achieves traction during its first operational year. They emphasize adoption rather than speculation as the primary driver.
Bitget’s research desk supports a similar direction. Their team highlights Monad’s technical efficiency and EVM compatibility as long-term advantages. They place medium-term targets around $0.13–$0.15, contingent on institutional participation and ecosystem maturity. Many analysts now treat the $0.1 level as a psychological checkpoint. A sustained break above that threshold would signal a transition from experimental asset to functional infrastructure.
Crypto researcher Alex Becker presents conditional optimism. He argues that Monad’s scalability could enable 2× gains in 2026, but he rejects the idea of automatic dominance. His position reflects a broader expert consensus: technological superiority alone does not guarantee price appreciation. Real adoption, active users, and fee generation determine long-term value. Without those factors, scalability remains theoretical.
The strongest criticism comes from Arthur Hayes, co-founder of BitMEX. He warns that Monad’s tokenomics create structural sell pressure. Hayes describes MON as a high fully diluted valuation asset with limited circulating float. He highlights that over 30% of supply unlocks during 2026, which could flood the market. In his view, artificial scarcity inflated early pricing. He later exited his position and publicly predicted severe downside risk. His stance rejects the narrative of Monad as an Ethereum successor.
Analyst Manya echoes skepticism from a capital efficiency perspective. She questions whether massive venture funding guarantees token success. Her argument centers on execution risk. Large budgets do not automatically create organic demand.
MON USDT Price Technical Analysis
Monad is trading around $0.023 and continues to demonstrate a steady bullish trend. Over the past 30 days, the token has gained approximately 11%. The price is currently slightly above former resistance zones.
CoinCodex, July 9, 2026
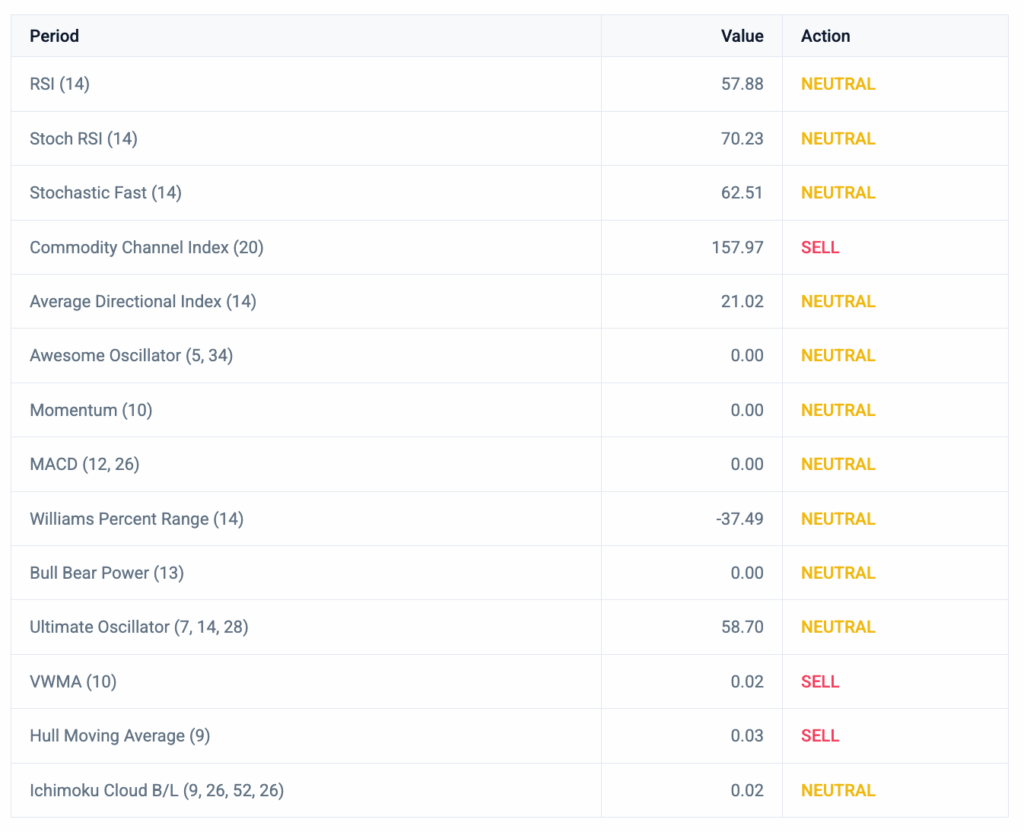
Indicator data confirms the bullish trend. Around 80% of technical signals are neutral.
Volatility remains elevated above 7%, which reflects unstable post-launch conditions. The relative strength index reads near 58. This value sits in neutral territory. The Fear and Greed Index registers extreme fear (22), which historically aligns with fragile sentiment and low conviction buying.
The overall picture for the month indicates gradual stabilization and growth. The price is moving toward historical highs. A sustained hold above $0.025 could form a base. A failure would open up new opportunities for decline. The future structure depends largely on the dynamics of the token supply and the actual activity of the ecosystem.
What Does the MON Price Depend On?
The price of MON does not move randomly. Several structural forces shape its direction. Some factors relate to market psychology. Others come from network mechanics and token supply. Understanding these drivers helps explain why price swings can appear extreme in early-stage blockchains.
The first major factor is token supply dynamics. Monad launched with a large fixed supply and a staged unlock schedule. When new tokens enter circulation, selling pressure increases. Early investors and airdrop recipients often realize profits quickly. That behavior can suppress price even when fundamentals improve. Markets react not only to technology, but to liquidity.
Adoption represents the second pillar. A blockchain gains value when people use it. Transactions, decentralized applications, and active wallets create organic demand. If developers build tools that attract real users, MON benefits from network effects. If activity stagnates, speculative interest fades. Price follows usage over time.
Investor confidence also plays a decisive role. Crypto markets run on narrative as much as metrics. Positive headlines can trigger aggressive rallies. Negative commentary can accelerate selloffs. Large holders influence short-term direction because their orders shift liquidity quickly. Early ecosystems often show exaggerated reactions to news.
Macroeconomic conditions amplify all of these elements. When the broader crypto market enters a bullish phase, capital rotates into emerging Layer 1 projects. In bearish cycles, investors prefer stability and reduce exposure to risk. MON trades inside this wider environment rather than in isolation.
Key drivers include:
- Token unlock schedules and circulating supply expansion.
- Developer adoption and application growth.
- Exchange liquidity and trading volume.
- Institutional participation and venture backing.
- Overall crypto market sentiment.
Technology remains important, but markets price expectations. Fast infrastructure alone does not guarantee appreciation. Sustainable value emerges when performance converts into real economic activity. The MON price ultimately reflects the balance between supply pressure and adoption growth. When demand outpaces emissions, price stabilizes. When supply dominates, volatility returns.
MON Coin Features
Monad positions itself as a performance-first Layer 1 while preserving Ethereum compatibility. Its design focuses on speed, scalability, and decentralization without fragmenting the developer experience. Instead of building a rollup or sidechain, the team redesigned the stack from the ground up. The result combines high throughput with familiar tooling.
At the consensus level, Monad introduces architectural changes that allow fast block production without sacrificing security. The protocol optimizes message flow and validator coordination to reduce bottlenecks.
Key consensus and performance features include:
- MonadBFT consensus, a pipelined Byzantine Fault Tolerant system with linear communication scaling.
- 10,000+ transactions per second throughput.
- 400ms block time for rapid settlement.
- 800ms full finality with speculative confirmation at 400ms.
- Sub-second confirmation suitable for trading and real-time applications.
Execution architecture represents another core innovation. Traditional chains process transactions sequentially. Monad breaks that limitation by running operations in parallel while preserving deterministic results. This model increases efficiency without compromising correctness.
Execution features include:
- Optimistic parallel execution of transactions.
- Asynchronous execution is decoupled from consensus.
- Deferred execution engine that separates ordering from processing.
- Superscalar pipelining across consensus, execution, and storage.
- Just-In-Time compilation for faster smart contract execution.
State management also plays a major role in scalability. Many blockchains demand expensive hardware to operate nodes. Monad reduces this burden through optimized storage design. Lower hardware barriers encourage validator participation and strengthen decentralization.
State and networking capabilities include:
- MonadDB, a custom database optimized for disk and memory efficiency.
- Merkle Patricia Trie architecture for secure state tracking.
- StateSync, which lets new nodes download snapshots instead of replaying full history.
- RaptorCast protocol for fast block propagation.
- linear communication scaling supporting large validator sets.
Developer compatibility remains a defining advantage. Monad maintains full Ethereum Virtual Machine support. Existing smart contracts migrate without modification. This eliminates friction for teams already building on Ethereum.
Developer-focused features include:
- 1:1 EVM bytecode compatibility.
- Support for MetaMask, Foundry, Hardhat, and standard Ethereum tools.
- Cancun fork opcode support including TSTORE and MCOPY.
- Identical opcode-to-gas mapping as Ethereum.
- Geth-compatible RPC interface.
Hardware accessibility reinforces decentralization. Consumer-grade machines can run full nodes effectively. The entire codebase remains open source and built in C++ and Rust, allowing public auditing and community contributions.
Together, these features position Monad as a high-speed infrastructure layer designed for real-world applications rather than experimental scaling. The architecture aims to deliver performance without fragmenting the Ethereum ecosystem.
MON Coin Price Prediction: Questions and Answers
Will Monad Be a Good Investment?
Monad carries both opportunity and risk. The project offers advanced infrastructure and strong funding, which supports long-term development. However, the token still trades in a highly speculative environment. Price depends on adoption, unlock schedules, and overall market cycles. Investors should treat MON as a high-volatility asset. Potential upside exists, but downside risk remains significant in early ecosystem stages.
How Much Is 1 Monad (MON)?
At the time of writing, 1 MON trades around $0.023. The price fluctuates within a narrow consolidation range after the post-launch correction. Short-term movements remain sensitive to liquidity and sentiment. Traders should expect rapid swings even during sideways periods. Real-time exchange data always provides the most accurate valuation.
What Is the Total Supply of Monad?
Monad has a fixed total supply of 100 billion MON. No additional tokens can be minted beyond that amount. Circulating supply expands gradually through unlock schedules. This structure means emission timing matters more than inflation. Supply pressure enters the market in phases rather than continuously.
How High Will Monad Crypto Go?
No model can predict an exact ceiling. Bullish projections assume strong developer adoption and network usage. Conservative scenarios expect slower ecosystem growth. Long-term targets vary widely among analysts. Some forecasts remain modest, while others assume exponential expansion. Price ultimately follows real demand, not theoretical capability.
Will Monad Reach $0.1?
A move to $0.1 requires roughly a 5× increase from current levels. Analysts view this as possible if adoption accelerates and liquidity improves. That level also represents a psychological milestone. Breaking it would signal structural recovery. However, it depends on sustained buying pressure and ecosystem traction.
Will Monad Reach $1?
A $1 valuation implies a massive market cap expansion. This scenario demands global adoption and sustained capital inflow. It cannot occur through speculation alone. Infrastructure success and real application usage would need to justify the valuation. Most analysts treat $1 as a long-term possibility rather than a near-term expectation.
Will Monad Reach $10?
A $10 target represents extreme optimism. It would require exponential ecosystem dominance and multi-cycle growth. Only a handful of Layer 1 assets achieved comparable scaling. Analysts consider this outcome highly speculative. It remains a theoretical ceiling rather than a practical forecast.
What Is the Price Prediction for Monad in 2026?
Forecasts for 2026 range from conservative stabilization to moderate recovery. Some analysts expect prices near $0.02–$0.03. Others project stronger rebounds above $0.04 under bullish conditions. Most scenarios assume gradual rebuilding after early volatility. Adoption metrics will determine which path unfolds.
What Is the Monad Price Prediction for 2030?
Long-term projections diverge sharply. Conservative models expect incremental growth. Aggressive forecasts assume Monad becomes major infrastructure. These scenarios produce wide price ranges. Analysts agree that 2030 valuation depends almost entirely on developer ecosystem strength and user activity.
Why Is Monad Crashing?
Price declines follow supply pressure and early profit taking. Airdrop distribution and unlock schedules increase circulating tokens. Markets often overreact during launch phases. Weak sentiment amplifies selling. The crash reflects liquidity dynamics rather than technical failure. Network fundamentals can improve while price still falls.
Is Monad on Ethereum?
Monad is not built on Ethereum, but it is fully compatible with Ethereum. It operates as an independent Layer 1 blockchain with its own consensus and infrastructure. However, developers can deploy Ethereum smart contracts without modification. This compatibility allows Monad to inherit Ethereum’s tooling and ecosystem while maintaining its own performance architecture.
Is Monad Better than Solana?
Monad and Solana pursue similar performance goals but use different designs. Monad emphasizes EVM compatibility and lower hardware requirements. Solana prioritizes raw throughput with a distinct execution model. “Better” depends on developer needs and adoption. Performance alone does not determine success. Ecosystem growth, stability, and real usage decide long-term leadership.
Where to Buy Monad Coin?
StealthEX is here to help you buy Monad if you’re looking for a way to invest in this cryptocurrency. You can buy MON safely and without the need to sign up for the service. StealthEX crypto collection has more than 2,000 different coins and you can do wallet-to-wallet transfers instantly and problem-free.
How to Buy Monad? Quick-Step Guide
Just go to StealthEX and follow these easy steps:
- Choose the pair and the amount you want to exchange — for instance, ETH to MON.
- Press the “Start exchange” button.
- Provide the recipient address to transfer your crypto to.
- Process the transaction.
- Receive your crypto coins.
Follow us on Medium, X, Telegram, YouTube, and Publish0x to stay updated about the latest news on StealthEX and the rest of the crypto world.
Don’t forget to do your own research before buying any crypto. The views and opinions expressed in this article are solely those of the author.
crypto price prediction MON Monad price analysis price predictionThe post Monad Price Prediction: Will MON Coin Reach $1 Soon? first appeared on StealthEX.]]>

Can Shiba Inu Reach $1 in 2026?
Shiba Inu is very unlikely to reach $1 in 2026. The main reason is not only price, but also supply. SHIB still has around 589 trillion tokens in circulation, so even a small move in price requires a huge amount of new money.
For SHIB to trade at $1, its market value would need to rise to hundreds of trillions of dollars, unless the supply fell dramatically first. That would make Shiba Inu bigger than the entire crypto market, the largest public companies, and even many global asset classes. The math does not support a $1 target for 2026.
However, this does not mean SHIB cannot grow. A strong bull market, better ecosystem use, higher demand, exchange listings, and larger token burns could support price gains. SHIB also has a large community, and community interest can still move meme coins during speculative market phases. Still, investors should separate possible upside from unrealistic price targets. In 2026, $1 looks like an extremely unrealistic target, not a normal Shiba Inu price prediction.
Why Is the $1 Target So Difficult?
The Shiba Inu $1 target sounds simple because the number looks small. However, crypto prices only make sense when investors compare price with supply. If one token costs $1 and almost 589 trillion tokens exist, the market cap would sit near $589 trillion. That number would be far beyond today’s realistic crypto market size and far beyond normal meme coin valuations.
Market cap means token price multiplied by circulating supply. For example, if SHIB trades at $0.000004, it can have a market value of only a few billion dollars because each token is cheap. But if the same supply trades at $1, the market value explodes. This is why beginners should never judge a coin only by its low price. A coin can look cheap and still need an enormous amount of capital to grow.
A move to $1 would also require demand on a scale that the market has never shown for a meme coin. Buyers would need to absorb huge selling pressure from holders who bought SHIB much lower. Many early investors would likely take profit long before $1, and that selling could slow any rally. For that reason, the $1 target depends on impossible-looking market cap math unless supply drops by hundreds of trillions of tokens first.
SHIB Supply and Market Cap
SHIB has a supply problem that beginners must understand before they follow any shiba inu coin $1 prediction. According to major market trackers, more than 589 trillion SHIB tokens trade in the market. Because market cap equals price multiplied by circulating supply, a $1 price would create a value near $589 trillion. That figure would not look like a normal crypto rally. It would require SHIB to become larger than the biggest financial markets in the world. For comparison, even Bitcoin has never reached that size. So, without a huge supply reduction and unmatched demand, the $1 target does not fit basic market cap logic.
How Much Would SHIB Need to Grow?
To understand the SHIB to $1 idea, compare $1 with SHIB’s current micro-price. If SHIB trades near $0.000004, a move to $1 would mean an increase of about 25,000,000%. That is not a typical bull market gain. It is a life-changing return that would demand extreme demand, constant buying pressure, and far less supply. Even if SHIB rose 10x or 100x, it would still remain far below $1. This is why investors should measure growth in realistic steps, such as removing one or two zeros, instead of focusing only on the final dollar target. That approach gives a clearer view of risk and reward.
Shiba Inu Price Prediction 2026
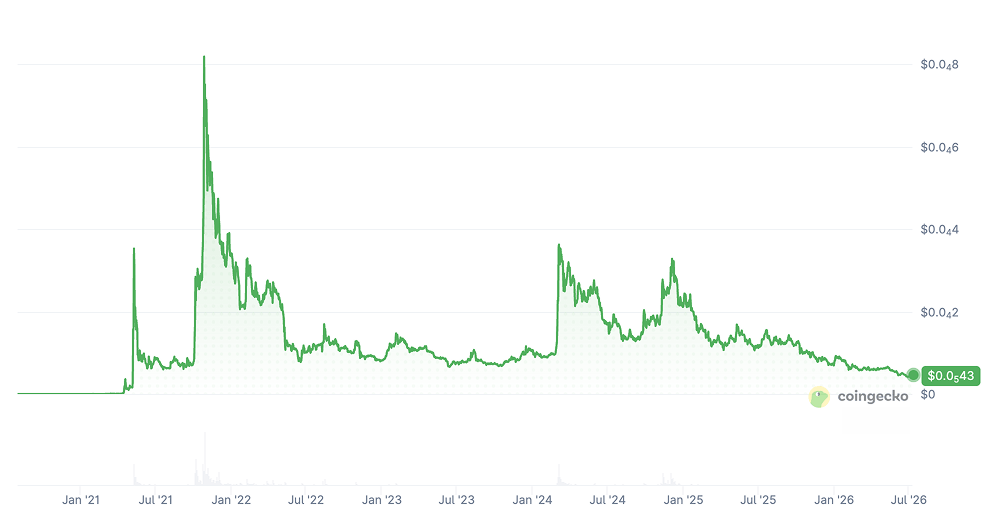
A realistic Shiba Inu price prediction 2026 should begin with current market data, not social media hype. According to CoinMarketCap, SHIB recently traded near $0.0000043, with a market cap close to $2.5 billion and a circulating supply of about 589.24 trillion tokens.
CoinGecko, July 9, 2026
These numbers matter because they show how much money SHIB needs to move higher. At the same supply, a price of $0.00001 would place SHIB near a $5.9 billion market cap, while $0.00005 would require almost $29.5 billion.
Forecasting sites also show very different views. CoinCodex gives a cautious 2026 estimate near $0.000003989 by the end of 2026. Changelly’s November 2026 range sits between about $0.00000424 and $0.00000559. CoinPedia is much more bullish and gives a 2026 range from about $0.00002 to $0.000099.
Based on these numbers, a realistic 2026 range sits far below $1. SHIB could still rise if the crypto market improves, but the $1 target would require a market cap near $589 trillion at today’s supply. That is why serious investors should compare price targets with market cap before they believe any bold prediction.
Bearish, Neutral, and Bullish Scenarios
In a bearish scenario, SHIB could stay close to its current range or move lower if crypto liquidity remains weak. A zone around $0.000003 to $0.000004 would match a cautious outlook and would also stay close to CoinCodex’s end-of-2026 forecast near $0.000003989. This scenario would show that meme coin demand remains limited.
In a neutral scenario, SHIB could trade around $0.000004 to $0.000006. This range fits closer to Changelly’s conservative monthly forecast for late 2026, which points to values around $0.00000424 to $0.00000559. In this case, SHIB would not break its long-term supply problem, but it could still hold attention from traders.
In a bullish scenario, SHIB could try to remove one zero and move toward $0.00002 or higher. CoinPedia’s 2026 forecast is much more optimistic and mentions a possible range up to $0.000099. However, even $0.000099 would place SHIB near a $58 billion market cap at the current supply. That would be a major rally, but it would still remain far from $1.
What Could Move SHIB in 2026?
The first major driver for SHIB in 2026 is the wider crypto market. If Bitcoin and large altcoins rise, traders often move into riskier assets, including meme coins. This can increase volume and push SHIB higher for a short period. However, if Bitcoin weakens, SHIB can fall faster because meme coins usually depend on market confidence.
The second driver is token utility. Shibarium, ShibaSwap, ecosystem apps, games, and community projects could help SHIB if they bring real users. Demand matters because a token with huge supply needs constant buying pressure to move higher.
The third driver is token burns. Burns reduce supply, but they must happen at a very large scale to change the long-term math. Small burns can support sentiment, yet they do not make $1 realistic by themselves.
Whale activity, exchange volume, social media trends, and meme coin hype can also move SHIB. Still, beginners should remember one key rule: SHIB can rally without reaching $1, and a realistic forecast should focus on market cap, not only token price.
Can Burns Help Shiba Inu Reach $1?
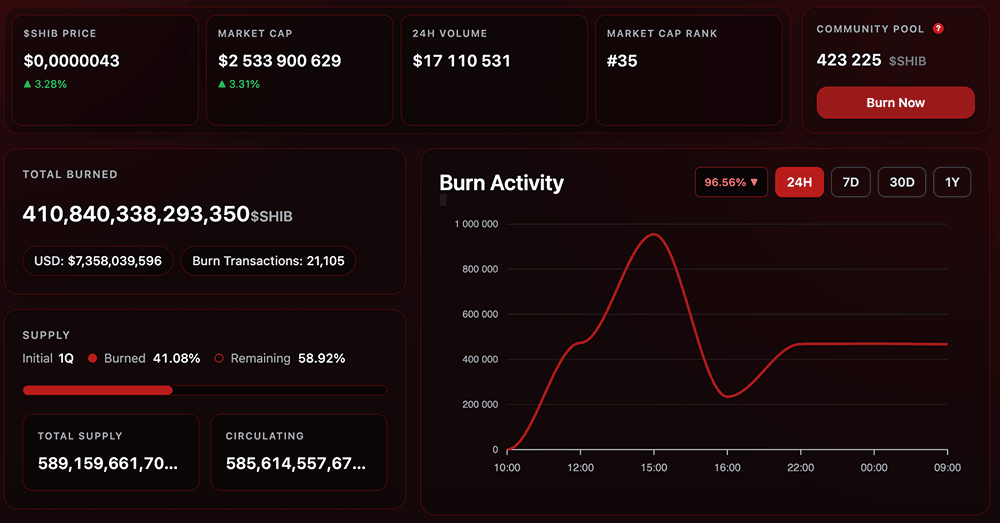
Token burns can help Shiba Inu, but they cannot make SHIB reach $1 quickly unless they remove an enormous part of the supply. According to CoinMarketCap, SHIB has about 589.24 trillion tokens in circulation. Shibburn also shows that more than 410.8 trillion SHIB have already been burned, mainly because a very large early burn removed tokens from the original supply.
Shibburn, July 9, 2026
The problem is scale. If SHIB kept today’s supply and reached $1, its market cap would stand near $589 trillion. That number does not fit a realistic crypto market. To make $1 possible at a $100 billion market cap, SHIB supply would need to fall to about 100 billion tokens. That means the market would need to remove more than 589 trillion tokens from circulation, or roughly 99.98% of today’s supply. At a $50 billion market cap, supply would need to fall to about 50 billion tokens, which requires an even larger burn.
This is why the question “how much Shiba needs to be burned to reach $1” has a difficult answer. Small daily burns can improve sentiment, but they do not change the math fast enough. SHIB would need massive burns, strong demand, and a much larger crypto market at the same time.
Why Token Burns Are Not a Simple Solution
Token burns sound powerful because they reduce supply. However, burns only help price when demand stays the same or grows. If investors lose interest, a lower supply alone may not create a lasting rally. SHIB also needs real trading volume, stronger ecosystem use, and a market mood that supports risky meme coins.
The chances of Shiba Inu hitting $1 depend on more than burn headlines. For example, burning millions or even billions of SHIB can look impressive, but it remains small compared with a supply of hundreds of trillions. To change the long-term outlook, burns must continue at a huge scale for years. Because of that, burns can support SHIB, but they do not make $1 realistic in 2026.
Could Shiba Inu Ever Reach 1 Dollar?
Shiba Inu could reach $1 only under a very extreme long-term scenario. The issue is not the number “1” itself. The issue is the supply behind that number. CoinMarketCap lists SHIB near $0.000004276, with about 589.24 trillion tokens in circulation and a market cap close to $2.51 billion. At the same supply, $1 would value Shiba Inu near $589 trillion. That is why the question “will Shiba Inu ever reach 1 dollar” needs a market cap answer first.
For $1 to look even remotely realistic, SHIB would need a massive supply reduction. If investors accepted a $100 billion SHIB market cap, the supply would need to fall to about 100 billion tokens. That means more than 99.98% of today’s circulating supply would need to disappear. If SHIB kept 1 trillion tokens, a $1 price would still mean a $1 trillion market cap, which would put it in the same broad value zone as the largest assets in crypto history.
So, yes, $1 is theoretically possible in math, but it looks unrealistic in practice unless burns, demand, and adoption change on a scale the market has not seen yet. A more careful long-term view should treat $1 as a distant, low-probability idea, not as a normal forecast.
What Is a More Realistic SHIB Target?
A more realistic SHIB target should start with market cap, not dreams about $1. At a circulating supply of about 589.24 trillion tokens, SHIB would have a market cap near $5.9 billion at $0.00001, about $11.8 billion at $0.00002, and almost $29.5 billion at $0.00005. These levels would still require strong demand, but they sit much closer to normal crypto market logic than $1.
For beginners, a move from about $0.0000042 to $0.00001 would already mean a gain of roughly 130%. A move to $0.00002 would mean about 370%. A move to $0.00005 would mean about 1,000%. Those are large returns, even though they remain far below $1. They also show why investors do not need impossible targets to see meaningful upside.
This is why the question “will SHIB hit $1” can distract investors from more useful targets. Removing one zero would already represent a major rally. Removing two zeros would require a much stronger bull market, higher trading volume, and better demand for the Shiba Inu ecosystem.
Key Risks to Consider Before Following SHIB Predictions
SHIB predictions can look exciting, but beginners should treat them with caution. The first risk is volatility. Meme coins can rise quickly, yet they can also fall sharply when traders lose interest. A small change in market mood can move SHIB more than larger crypto assets.
The second risk is supply. SHIB has hundreds of trillions of tokens in circulation, so every higher target needs a larger market cap. This makes the road to $1 much harder than many social media posts suggest.
The third risk is hype. Influencers, viral posts, and price prediction websites often focus on upside because bold numbers attract attention. However, they do not guarantee demand. Investors still need to check volume, liquidity, market cap, burns, and wider crypto conditions.
The fourth risk is execution. Shiba Inu needs ecosystem growth, useful products, active development, and real users if it wants stronger long-term demand. Without that, SHIB may depend mainly on speculation. For that reason, no SHIB prediction should replace personal research or risk management.
FAQ
Will Shiba Inu Coin Reach $1?
Under current market conditions, this target looks extremely unlikely. SHIB still has hundreds of trillions of tokens in circulation, so a $1 price would require an enormous market cap. Without massive burns and much stronger demand, the $1 scenario remains unrealistic.
Will Shiba Inu Reach $1 in 2026?
A $1 price in 2026 does not look realistic. SHIB could still rise if the crypto market becomes stronger, but this target would require a market value far beyond normal meme coin levels. Investors should focus on smaller and more realistic price ranges.
Can Shiba Inu Coin Reach $1?
In theory, SHIB could reach $1 only if its supply fell dramatically and demand grew at an exceptional scale. In practice, the current supply makes this target very hard to support. Market cap math shows why beginners should treat $1 predictions with caution.
When Will Shiba Inu Hit $1?
There is no reliable timeline for SHIB reaching $1. Most predictions that mention this target depend on extreme assumptions about burns, demand, and future market growth. Unless SHIB removes most of its supply, $1 does not look realistic in the near or medium term.
Can SHIB Hit $1 If Most Tokens Are Burned?
This could become more realistic only if SHIB burned almost all of its circulating supply while keeping strong investor demand. Smaller burns can support sentiment and community interest, but they do not change the market cap math enough to make $1 realistic by themselves.
Is It Possible for Shiba to Reach $1?
In pure theory, yes. In real market terms, it looks highly unlikely. SHIB would need a much smaller supply, huge demand, and a market cap that fits global crypto liquidity. A more realistic view focuses on removing zeros rather than reaching $1.

Follow us on Medium, X, Telegram, YouTube, and Publish0x to stay updated about the latest news on StealthEX and the rest of the crypto world.
Don’t forget to do your own research before buying any crypto. The views and opinions expressed in this article are solely those of the author.
crypto meme crypto price prediction SHIB Shiba Inu ShibaSwapThe post Can Shiba Inu Reach $1 in 2026? first appeared on StealthEX.]]>
Aave’s Monad Debut Turns Incentives Into Instant Liquidity
Aave’s arrival on Monad gave DeFi traders a fast lesson in how quickly capital moves when rewards, infrastructure and narrative line up. The V3 market passed $100 million in deposits within two days, which shows that lenders still chase new opportunities when a chain offers low fees, quick execution and a clear incentive runway.
The early surge did not happen by accident. Monad committed major support for the launch, including millions in incentives and a large GHO position, while the Aave DAO added its own liquidity push. That mix helped lenders move before borrowing demand had time to prove itself, and it also gave market makers a reason to test Monad’s rails early.
The bigger question now sits on the borrower side. Deposits can arrive quickly, yet they only stay when traders, apps and liquidity desks actually borrow at scale. Risk teams have already adjusted caps, which should help limit concentration while the market matures. Lenders now need to watch utilization, oracle stability, cap changes and GHO activity, because rewards alone cannot build a durable lending market. If real borrowing grows before incentives fade, Monad may turn a fast launch into a lasting DeFi venue for serious crypto capital long-term.
Binance UK Perps Case Puts Global Derivatives Playbooks Under Pressure
A new legal fight in London could force crypto exchanges to rethink how they offer perpetual futures to users in restricted markets. Almost 1,700 UK investors have brought a coordinated claim against Binance-related entities and Changpeng Zhao, seeking at least £150 million over allegations that retail traders accessed leveraged crypto derivatives without the required UK authorisation.
The case matters because Britain has drawn a firm line around these products. Since 2021, the FCA has banned firms from selling crypto derivatives, including futures, options and CFDs, to retail consumers. Perpetuals may look simple inside a trading app, yet regulators treat them as high-risk derivatives because leverage, funding rates and round-the-clock volatility can punish inexperienced users quickly.
Whatever the court decides, exchanges that touch UK users will likely face more pressure to prove that their geo-fencing, onboarding checks, affiliate activity and product messaging actually work. The case also lands as the US tests regulated perpetual products, while Europe continues to separate MiCA’s spot-crypto rules from derivatives law. For traders, the practical takeaway feels clear: offshore access may become harder, regulated venues may gain ground, and platforms may redesign perps around location, permission level and compliance rather than pure trading demand alone.
eToro’s Extended Bet Brings On-Chain Perps Closer to Broker Apps
eToro’s investment in Extended signals that on-chain perpetuals are moving from DeFi-native dashboards toward mainstream trading interfaces. The broker led a $12.5 million round in the derivatives venue, which has reported more than $245 billion in cumulative trading volume and support for over 100 perpetual markets. That scale gives a large broker something serious to integrate rather than a small experiment.
The planned link with Zengo, the self-custody wallet eToro acquired, points to a bigger shift. Users may eventually open a broker-style app, connect or create a wallet, deposit collateral into smart contracts and trade perps without sending funds to a centralized exchange. The broker controls the screen, the education layer and the routing, while the user keeps custody through wallet-based flows.
That model could reshape competition in crypto derivatives. Centralized exchanges built the perp market through speed, leverage and liquidity, but brokers already own distribution and consumer trust. On-chain rails add transparency, programmable risk and wallet control, although traders still face oracle issues, gas costs and slippage during stress. If eToro can package Extended’s engine inside a clean user experience, broker apps may become the next major gateway into DeFi’s most active trading product for regular active users.
PUMP Unlock Sets Up a Weekend Test for Solana Meme Liquidity
PUMP holders face a key supply event on July 12, and traders are already debating how much pressure the market can absorb. One tracker points to about 19.17 billion PUMP entering circulation, equal to roughly 1.9% of total supply and worth around $31 million at referenced prices. Another view shows a much larger unlock value near $147 million when measured against float and broader recipient groups.
That gap matters because traders care less about headline tokenomics than about what actually reaches exchanges and DEX pools. If recipients hold, move tokens slowly or use private arrangements, the market may digest the event without major damage. If large chunks hit order books during quiet weekend hours, Solana’s meme liquidity could react sharply.
Pump.fun’s buyback program adds another layer to the setup. The platform has reportedly spent more than $400 million buying and burning PUMP, creating a real protocol bid that can soften selling pressure when activity stays strong. Yet buybacks depend on revenue, and revenue depends on launchpad traffic. The July unlock will therefore test more than one token. It will show whether Solana meme demand, platform fees and on-chain liquidity can handle fresh supply when traders move fast.
Zcash Tries to Turn Orchard Scare Into an Ironwood Reset
Zcash has moved from emergency repair mode into a more important trust rebuild. After developers disclosed a serious Orchard circuit issue in late May, the network pushed through the NU6.2 hard fork on June 3, 2026, at block 3,364,600. That upgrade corrected the circuit and brought shielded activity back online, while exchanges and infrastructure providers worked through temporary pauses around the transition.
The next step, Ironwood, aims to solve a deeper market problem: confidence in supply. The proposal introduces a new fixed Orchard-based shielded pool and a turnstile-style migration, which should let observers verify circulating supply without exposing private user activity. For a privacy coin, that balance matters because any security scare can quickly turn into fears about hidden inflation.
ZEC’s price already showed how sensitive the market remains. The coin dropped heavily after the disclosure, then rebounded as the patch landed and Ironwood entered the discussion. That bounce does not guarantee a comeback, but it shows traders still see optionality if the technical reset works. Wallets, exchanges and node operators now need to coordinate cleanly. If Ironwood activates smoothly and users migrate without confusion, Zcash can turn a painful incident into a stronger privacy-and-auditability story again.
Dormant Bitcoin Wallet Lawsuit Tests the Meaning of Digital Ownership
A New York lawsuit over thousands of inactive Bitcoin addresses could become one of the most important legal tests for self-custodied crypto. The case targets 39,069 wallets that plaintiffs want treated under unclaimed property principles, while the Digital Chamber has stepped in with another amicus brief warning that such a move could weaken digital property rights.
The dispute looks unusual because the numbers are enormous. Reports link the wallets to about 3.7 million BTC, worth hundreds of billions of dollars, and some observers have even suggested that certain addresses may connect to Bitcoin’s earliest era. That possibility adds drama, yet the real issue sits in the legal logic. If courts treat dormant wallets as abandoned property, owners of self-custodied assets could face uncertainty simply because they have not moved coins for many years.
Recent activity from some listed addresses complicates the picture. Thousands of BTC have reportedly moved from wallets named in the dispute, including coins that had stayed still for more than a decade. Even so, legal title does not equal technical control in Bitcoin. Without private keys, plaintiffs cannot actually spend the coins. The court may influence future property law, but cryptographic control will still decide who can move Bitcoin.
Bernstein Says Bitcoin’s Slide Still Falls Short of a True Cycle Collapse
Bitcoin’s latest drawdown has scared late buyers, but Bernstein does not see it as proof that the bull cycle has ended. Analyst Gautam Chhugani reportedly kept the firm’s $150,000 year-end target in place, arguing that the current fall from the October 2025 peak near $125,000 remains far smaller than the 75% to 90% crashes that ended previous Bitcoin cycles.
That comparison matters because Bitcoin has often looked broken before it resumed a larger trend. A 54% decline can destroy leveraged positions and shake confidence, yet it does not match the scale of the 2013, 2018 or 2022-style collapses. Bernstein’s view suggests the market has gone through a harsh reset rather than a full structural failure.
The call now depends on capital flows. Spot ETF demand, stablecoin liquidity, on-chain activity and exchange leverage will decide whether the recovery can gather speed. Institutional interest has not vanished, and money continues to move into tokenization, staking and payment infrastructure, which suggests crypto capital may have rotated instead of leaving completely. Still, Bitcoin needs a strong second-half rebound to reach $150,000 by year-end. Macro pressure, US policy debates and slow summer liquidity could delay the flow revival that Bernstein expects soon.
Strategy Turns Its Bitcoin Treasury Into an Active Capital Machine
Strategy has unveiled a Digital Credit Capital Framework that changes how the market reads its Bitcoin treasury strategy. The company still presents Bitcoin as its main reserve asset, yet its new plan adds liquidity tools, buybacks, dividend adjustments and potential BTC monetization at a time when its stock has fallen sharply.
The framework includes a US dollar reserve, a higher STRC dividend rate, buyback programs for preferred securities and common stock, plus authority to sell up to $1.25 billion in Bitcoin. Strategy says its dollar reserve stood near $2.55 billion on June 28, enough to cover about 17.4 months of preferred dividends and bond interest. With possible Bitcoin sales, coverage could rise to roughly 25.9 months.
The company also authorized up to $2 billion in buybacks, split between MSTR common shares and STRC preferred stock. It raised STRC’s annual dividend rate to 12%, aiming to pull the security closer to its $100 face value after a steep discount.
This marks a clear evolution from simple accumulation. Strategy now treats Bitcoin as a balance sheet instrument it can manage, not just hold forever. That may strengthen credit quality and reassure preferred holders, but it also forces BTC investors to watch company-level liquidity decisions more closely.
Strategy’s Bitcoin Sales Shift the Debate From Fear to Liquidity
Strategy’s decision to sell more Bitcoin has shaken traders, yet some analysts argue that the move may actually reduce pressure on the market. After an earlier sale of 32 BTC, the company disclosed another sale of 3,588 BTC worth about $216 million, adding cash at a time when investors have focused heavily on its funding needs.
The immediate reaction looked nervous, as Bitcoin slipped below $62,000 after the news, but Grayscale analysts framed the sale as a stabilizing step rather than a warning sign. Their argument is simple: Strategy still holds a massive Bitcoin treasury, carries manageable debt and now has more dollar liquidity to meet preferred dividend obligations. That cash cushion can calm fears that the company might need to sell coins in a rushed or disorderly way later.
The debate also shows how Strategy’s role in Bitcoin has changed. It no longer acts only as a relentless buyer. The company has started to manage liquidity more actively, which may help protect its balance sheet but also adds a new variable for BTC traders. JPMorgan has warned that a firm acting as both buyer and seller can create uncertainty. Grayscale, however, sees planned sales and clearer funding as healthier than market rumors and speculation.
Crypto Hackers Took Less Often, But Hit Much Harder in 2026
Crypto security losses stayed painfully high in the first half of 2026, even though attackers appeared to focus on fewer, larger wins. CertiK’s Hack3d report estimated that projects lost about $1.32 billion across 344 incidents, with wallets, infrastructure and older contracts sitting near the center of the damage.
The headline total came in below the same period last year, but that comparison can mislead because 2025 included the huge Bybit breach. Once analysts remove that outlier, the 2026 picture looks more troubling. Attackers have not disappeared; they have become more selective, and high-value exploits now shape the market’s risk profile.
Two incidents showed the scale of the problem. Kelp DAO’s RPC compromise and Drift Protocol’s wallet breach together accounted for roughly $576.6 million in losses, nearly half of the H1 total. Wallet compromises caused the most financial damage overall, while smart contract flaws remained the most frequent entry point. Phishing also changed character, with fewer broad campaigns and more targeted social engineering against people or teams controlling serious funds.
Ethereum recorded the largest losses by chain, while cross-chain incidents remained costly because bridges and multi-network systems create complex attack surfaces. As more capital moves on-chain, projects need stronger key management, repeated audits and tighter operational controls.
Deutsche Bank’s Ripple Push Keeps XRP’s Real Question Alive
Deutsche Bank’s reported expansion of Ripple payment technology has given XRP supporters another reason to watch institutional plumbing rather than short-term price action. Analyst Dr. Kamilah Stevenson described the move as part of a broader change in how major banks handle cross-border payments, foreign exchange, multi-currency accounts and digital assets.
The key detail, however, is easy to miss. A bank can use Ripple’s software without using XRP. Ripple sells payment and settlement tools, while XRP can serve as a bridge asset when institutions want on-demand liquidity between currencies. Reports about Deutsche Bank point to broader Ripple infrastructure, but they do not confirm that the bank uses XRP for liquidity.
That distinction matters for investors. Messaging upgrades can speed settlement and reduce friction, yet they do not automatically create token demand. XRP’s stronger thesis depends on banks choosing liquidity bridges that replace or reduce nostro and vostro balances, which currently lock large amounts of capital across jurisdictions. If institutions move value through XRP instead of parking cash around the world, the token gains a clearer role.
For now, the story looks more like infrastructure adoption than a direct XRP catalyst. Deutsche Bank also explores other blockchain rails, which suggests large banks are testing many systems at once. The meaningful signal will come when integrations move from software plumbing to token-based liquidity.
Law-Enforcement Backing Gives Crypto Market Bill Fresh Senate Momentum
The CLARITY Act has gained a politically useful endorsement as Senate negotiators work to finalize US crypto market-structure rules before the August recess. The National Organization of Black Law Enforcement Executives has backed the bill, giving supporters a stronger answer to critics who argue that crypto legislation could weaken enforcement.
The timing matters because the bill’s compliance language has become one of its most sensitive battlegrounds. Supporters can now point to NOBLE’s position as evidence that the proposal does not simply reflect industry demands, especially around provisions designed to tackle illicit finance. That law-enforcement support may help lawmakers defend the text as negotiations enter the final stretch.
SEC Commissioner Hester Peirce has also signaled that she expects the bill to reach a full Senate vote before lawmakers leave for summer break. That does not guarantee passage, but it shows that the legislation has moved beyond abstract debate. It has already cleared major hurdles, and the remaining fight appears focused on exact wording, agency authority and enforcement mechanics.
For crypto markets, the stakes remain high. A workable US framework could support exchange activity, institutional participation and confidence in tokens that have long operated in legal gray zones. A delay, however, would keep policy uncertainty alive and could once again slow capital flows.
Trump’s Crypto Income Puts Presidential Finance Under a New Spotlight
President Donald Trump’s latest financial disclosure has pulled crypto deeper into America’s political ethics debate. A 927-page filing with the US Office of Government Ethics reportedly shows that Trump earned more than $1 billion from crypto-related business activity in 2025, his first year back in office, with digital assets forming a major part of his reported income.
The largest figures came from Trump-branded crypto ventures. The disclosure listed $635 million in royalties tied to a TRUMP meme coin and NFT, even though the token has fallen sharply from its post-launch highs. It also showed more than $500 million in income from World Liberty Financial, a crypto project connected to his family and the family of special envoy Steve Witkoff.
The White House has rejected conflict-of-interest claims, arguing that Trump’s businesses sit in a trust managed by his sons and that his administration has supported America’s crypto industry. Critics focus on a different point: unlike a blind trust, this structure still leaves Trump aware of his holdings, while policy decisions can influence the same sector that generated large personal income.
The filing highlights how quickly crypto has moved from a niche investment theme into the center of political power. It also raises harder questions about disclosure, influence and the financial interests of sitting officials.
Taiwan Replaces Crypto Registration With Full Licensing Regime
Taiwan has moved from basic crypto registration to a full licensing system after lawmakers passed the Virtual Asset Service Act on July 1. The new framework gives the Financial Supervisory Commission direct authority over virtual asset service providers and stablecoin issuers, replacing the country’s earlier anti-money-laundering registration model with a broader operating regime.
Crypto firms that want to serve Taiwan must now obtain formal approval from the FSC. The law sets requirements around governance, custody, cybersecurity, risk controls and internal compliance, bringing digital asset businesses closer to standards used in traditional finance. Companies that already completed AML registration will not receive an automatic pass. They get 12 months to apply for a license and 21 months to secure approval.
Stablecoins face an even clearer shift. Issuers must now receive FSC authorization before launching tokens in Taiwan, which places these products under financial supervision rather than treating them as ordinary crypto assets. That approach reflects growing concern that stablecoins function like payment tools and can affect consumer protection, reserves and settlement risk.
Taiwan’s move fits a global pattern. Europe has rolled out MiCA, US lawmakers continue to debate market-structure rules, and Asian regulators increasingly want clear licensing rather than light-touch registration. Crypto firms now face fewer gray areas but higher compliance costs.
This article is not supposed to provide financial advice. Digital assets are risky. Be sure to do your own research and consult your financial advisor before investing.
Bitcoin CoinStats crypto world CryptoDaily DailyCoinThe post Aave on Monad, Binance Case, PUMP Unlock & Zcash Reset first appeared on StealthEX.]]>
At the time of writing, Beldex (BDX) is trading at approximately $0.088, which is also near its highest level in the past month. Previously, on June 12, the token experienced a sharp but brief decline when its price briefly dropped to approximately $0.012 before quickly recovering. Except for this sudden correction, BDX has shown relatively stable growth between $0.008 and $0.009 over the past month.
In this guide, you will discover the latest BDX price predictions, historical price performance, technical analysis, and long-term forecasts extending through 2026, 2027, 2030, and beyond. You will also learn which factors influence the value of Beldex, what experts expect from the project, and how beginners can interpret price projections without needing advanced trading knowledge. So, let’s get started!
| Current BDX Price | BDX Price Prediction 2026 | BDX Price Prediction 2030 |
| $0.088 | $0.13 | $0.21 |
Beldex (BDX) Overview
Beldex (BDX) is a privacy-focused cryptocurrency that aims to give users greater control over their digital transactions and online activity. Unlike many traditional blockchain networks, Beldex places a strong emphasis on anonymity, data protection, and censorship resistance. The project has evolved from a simple privacy coin into a broader ecosystem that includes products such as BChat, BelNet, Beldex Browser, and cross-chain privacy solutions.
The Beldex network uses a decentralized architecture that helps conceal transaction details while maintaining security and transparency at the blockchain level. As concerns about digital privacy continue to grow worldwide, Beldex has positioned itself as a project that focuses on protecting user information without sacrificing usability.
From an investment perspective, BDX has gradually transformed from a niche privacy token into a mid-sized cryptocurrency with a market capitalization above $600 million. Despite experiencing periods of volatility, the coin has shown resilience during difficult market conditions and continues to attract investors interested in privacy-focused blockchain technology. As a result, many long-term Beldex price predictions remain closely tied to the adoption of privacy applications and the overall growth of the Beldex ecosystem.
BDX Price Statistics
| Metric | Value |
| Current Price | $0.088 |
| Market Cap | $693,745,619 |
| Volume (24h) | $19,524,197 |
| Market Rank | #210 |
| Circulating Supply | 7,869,277,276 BDX |
| Total Supply | 9,938,217,276 BDX |
| 1 Month High / Low | $0.09279 / $0.01236 |
| All-Time High | $0.1716 |
| All-Time Low | $0.01236 |
BDX Price Chart
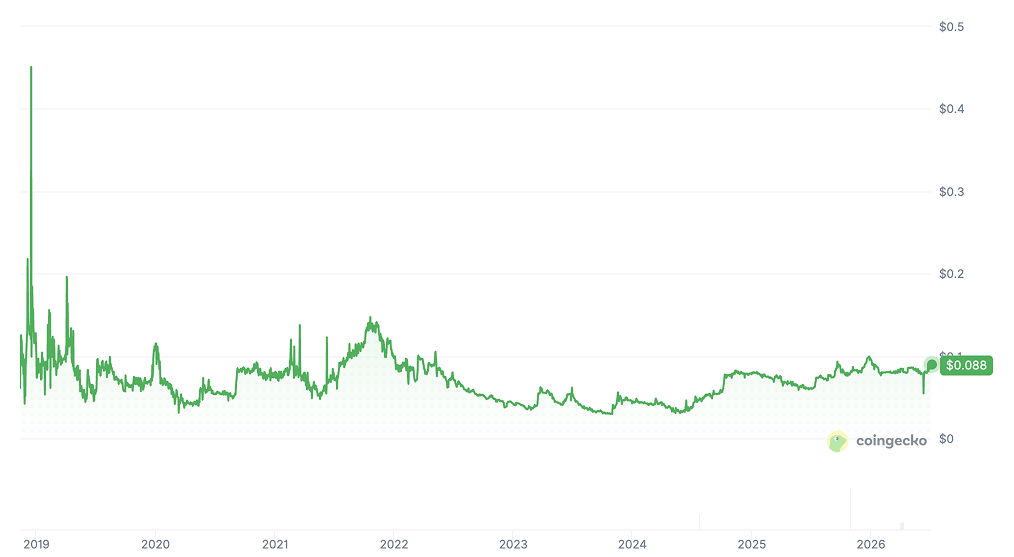
CoinGecko, July 3, 2026
Beldex (BDX) Price History Highlights
2019 – The First Steps on the Market
After reaching its historical peak during its earliest trading period in 2018, Beldex spent much of 2019 stabilizing and building its ecosystem. The project shifted its focus toward becoming a privacy-first blockchain rather than simply another cryptocurrency. Trading activity remained relatively modest, while developers concentrated on long-term infrastructure and community growth instead of short-term price performance.
2020 – Consolidation and a Slow Rise
Throughout 2020, BDX traded within a relatively narrow range as the project continued expanding its technology. While Bitcoin and other major cryptocurrencies recovered strongly after the pandemic-related crash, Beldex followed a slower and more sustainable path. Investors gradually became more interested in privacy-focused projects, helping the token establish stronger long-term support levels.
2021 – A Bull Market and a Major Upgrade
The cryptocurrency bull market of 2021 brought renewed attention to Beldex. Although the token did not surpass its historical all-time high from 2018, it benefited from improving market sentiment and ongoing ecosystem expansion. The launch of additional privacy products and network upgrades strengthened investor confidence, allowing BDX to outperform many smaller blockchain projects during the broader market rally.
2022 – Crypto Bear Market Pressure
The collapse of the global crypto market in 2022 affected Beldex just as it did most digital assets. Higher interest rates, declining liquidity, and several industry bankruptcies reduced investor appetite for risk. Despite the difficult environment, the Beldex team continued developing its ecosystem, helping the project retain a loyal community while many competing projects disappeared from the market.
2023 – Market Bottom and Slow Recovery
In 2023, BDX entered a prolonged consolidation phase as volatility declined across the cryptocurrency market. Instead of speculative rallies, the project focused on product development, including BChat, BelNet, and other privacy-oriented services. This steady progress helped strengthen the project’s fundamentals while investors waited for the next major market cycle.
2024 – Renewed Attention and Stronger Momentum
As the crypto market recovered during 2024, Beldex gradually regained momentum. Growing interest in decentralized privacy solutions and blockchain applications supported higher trading activity, while the ecosystem continued expanding. Although BDX remained well below its historical record, the token established a stronger long-term trend and attracted new investors looking beyond mainstream cryptocurrencies.
2025 – Growth, Pullbacks, and Market Maturity
During 2025, Beldex traded with noticeably lower volatility than many comparable altcoins. The token experienced several healthy corrections, but buyers consistently defended key support levels. Continued ecosystem development and increasing adoption helped BDX mature into a more stable digital asset, with a market capitalization comfortably above half a billion dollars for much of the year.
2026 – New Achievements and New Heights
In 2026, Beldex continued to rank among the leading privacy-focused cryptocurrencies. The token traded around $0.08, supported by a market capitalization exceeding $600 million and a circulating supply of roughly 7.7 billion BDX. During the sharp market correction on June 12, the price briefly dropped to around $0.012 before recovering to monthly highs near $0.09, demonstrating strong buying interest despite short-term volatility.
Short-Term Beldex Price Targets
Beldex (BDX) Price Prediction Today
According to CoinCodex, Beldex is expected to trade around $0.088 today, with virtually no change from current levels. The platform’s algorithm suggests that the market remains in a consolidation phase after the recent volatility, indicating balanced buying and selling pressure. Meanwhile, DigitalCoinPrice projects an average June price of $0.09, supporting the view that BDX is likely to remain stable in the immediate term.
Beldex (BDX) Price Prediction Tomorrow
Short-term forecasts point to another relatively quiet trading session. CoinCodex predicts BDX will remain near $0.089, while MEXC‘s forecasting model estimates a similar price around $0.088 for the following day. Both projections suggest that no major breakout is expected unless Bitcoin or the broader cryptocurrency market experiences a sudden shift in momentum.
Beldex (BDX) Price Prediction This Week
The weekly outlook remains cautiously optimistic. CoinCodex expects BDX to trade between $0.088 and $0.089, representing a potential gain of roughly 1.5% by the end of the week. Technical analysis published by CoinDCX also points to a stabilization phase, with support around $0.09 and resistance near $0.094, suggesting that moderate upside remains possible if market sentiment improves.
Beldex (BDX) Price Prediction Next Month
Forecasts become considerably more diverse when looking one month ahead. DigitalCoinPrice expects BDX to trade between $0.088 and $0.09 during July 2026, indicating another month of sideways movement. In contrast, PricePrediction.net forecasts a much wider range between $0.079 and $0.097, while CoinCodex’s algorithm projects a stronger rally toward $0.12, representing an increase of more than 30% from current prices.
Beldex Price Prediction: 2026, 2027, 2030-2050
| Year | Minimum Price | Maximum Price | Average Price | Price Change |
| 2026 | $0.088 | $0.18 | $0.13 | +45% |
| 2027 | $0.1 | $0.22 | $0.16 | +80% |
| 2030 | $0.13 | $0.39 | $0.21 | +140% |
| 2040 | $0.19 | $0.2 | $0.2 | +130% |
Beldex (BDX) Coin Price Prediction 2026
DigitalCoinPrice estimate that in 2026, Beldex could trade between $0.088 (0%) at the lower end and $0.0988 (+19%) at its yearly peak. Their forecast suggests a relatively stable year, with temporary weakness during autumn followed by a modest recovery toward the end of the year.
According to PricePrediction, BDX may experience significantly stronger upside in 2026. Its projections place the token between $0.0925 (+5%) and $0.18 (+105%), reflecting expectations of improving market sentiment and increased adoption throughout the second half of the year.
BDX Crypto Price Prediction 2027
DigitalCoinPrice expects Beldex to continue its gradual appreciation in 2027, forecasting a price range between $0.1 (+15%) and $0.12 (+35%). The model suggests steady ecosystem growth and continued accumulation could support higher valuations.
PricePrediction presents a more optimistic, yet volatile, outlook. Its forecasts indicate BDX could trade between $0.12 (+35%) and $0.22 (+150%), implying substantial upside potential despite expected market fluctuations during the year.
BDX Token Price Prediction 2030
By 2030, DigitalCoinPrice believes Beldex may trade between $0.13 (+50%) and $0.17 (+95%), reflecting gradual long-term expansion and continued development of the project’s privacy-focused ecosystem.
PricePrediction projects a significantly higher valuation by 2030. Its estimates range from $0.27 (+200%) to $0.39 (+350%), assuming broader blockchain adoption, stronger investor demand, and sustained growth across the cryptocurrency market.
Beldex Price Prediction 2040
DigitalCoinPrice forecasts Beldex to reach between $0.19 (+115%) and $0.2 (+125%) by 2040. These projections suggest long-term appreciation driven by increasing network maturity and wider adoption of decentralized privacy solutions.
BDX Coin Price Prediction 2050
Looking further ahead, DigitalCoinPrice estimates that Beldex could trade between $0.19 (+115%) and $0.2 (+125%) by 2050. Such projections assume decades of ecosystem development, continued blockchain adoption, and favorable long-term market conditions.
Beldex (BDX) Price Prediction: What Do Experts Say?
Most experts agree that Beldex’s future depends less on short-term speculation and more on the real-world adoption of its privacy ecosystem. CoinMarketCap‘s AI analysis highlights products such as the Beldex Name Service (BNS), merchant integrations, and privacy applications as key drivers that could increase demand for BDX over time. At the same time, the report warns that regulatory scrutiny surrounding privacy coins and competition from projects like Monero and Zcash remain significant risks.
Other forecasting platforms take a more conservative approach. CoinLore, Traders Union, and WEEX expect gradual growth, with BDX remaining close to its current valuation while benefiting from steady ecosystem expansion. In contrast, Gate.com publishes a much more aggressive forecast, projecting multi-fold gains by 2026. Given the large gap between these models, investors should treat extremely bullish targets with caution and focus on fundamentals, adoption, and overall cryptocurrency market conditions rather than optimistic price estimates alone.
BDX USDT Price Technical Analysis
According to the latest Investing.com technical analysis, the outlook for BDX/USDT remains highly positive. The platform currently assigns the pair an overall “Strong Buy” rating, with all 12 major moving averages generating Buy signals. Technical indicators are also supportive, although a few suggest that short-term volatility should still be expected.
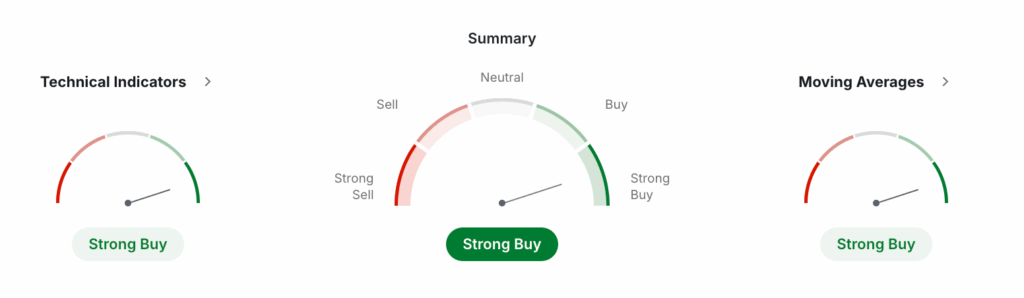
Investing, July 3, 2026
Overall, the chart indicates that buyers remain in control and that the broader trend continues to favor higher prices unless key support levels are broken.
BDX 50-Day SMA, 200-Day SMA and RSI
Three indicators stand out when evaluating the current trend:
- 50-Day SMA: $0.051 (Buy)
- 200-Day SMA: $0.013 (Buy)
- RSI (14): 62 (Buy)
The fact that BDX trades well above both the 50-day and 200-day Simple Moving Averages confirms a strong long-term uptrend. At the same time, the Relative Strength Index (RSI) remains below the overbought threshold of 70, suggesting that the rally may still have room to continue before buyers become exhausted.
BDX Key Price Levels
Support and resistance levels help traders identify potential reversal points where buying or selling activity could increase. Based on the latest Classic Pivot Points from Investing.com, BDX is currently trading near its central pivot at $0.079, placing it in a key decision zone.
Support Levels
The nearest support levels are:
- S1: $0.049
- S2: $0.015
- S3: $-0.008
As long as BDX stays above $0.072, the short-term trend remains constructive. If sellers push the price below $0.07, bearish momentum could strengthen and lead to a larger correction.
Resistance Levels
The closest resistance zones are located at:
- R1: $0.107
- R2: $0.129
- R3: $0.164
A breakout above $0.1 would likely strengthen bullish sentiment and could signal the beginning of another upward move. Higher trading volume near these levels would provide additional confirmation of a successful breakout.
Simple Moving Average (SMA)
The Simple Moving Average (SMA) analysis is one of the strongest bullish signals currently available for BDX.
Since the current market price remains above every major SMA, the long-term trend continues to favor buyers.
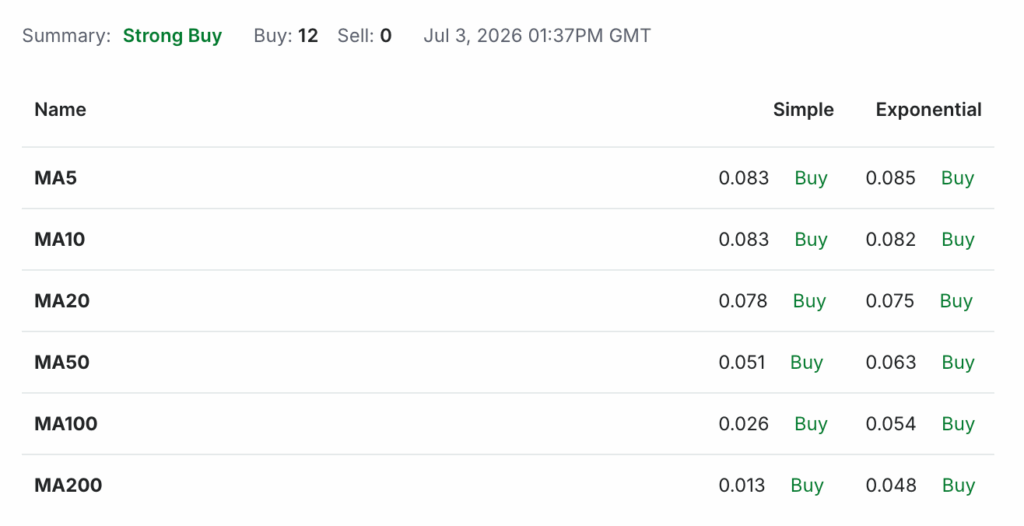
Investing, July 3, 2026
Exponential Moving Average (EMA)
The Exponential Moving Average (EMA) indicators also point toward continued strength.
Unlike SMAs, EMAs respond more quickly to recent price changes. The fact that every major EMA generates a Buy signal suggests that bullish momentum remains intact across both short-term and long-term timeframes.
BDX Oscillators
Oscillators provide additional insight into market momentum. While not all indicators agree, the overall picture remains positive.
Main bullish indicators:
- RSI (14): 62.001
- STOCH(9,6): 66.38
- MACD(12,26): 0.01
- Williams %R: -23.767
- Ultimate Oscillator: 58.856
- Rate of Change (ROC): 39.783
Bearish indicators:
- Stochastic RSI: 53.351 Neutral
- ADX: 35.826 Sell
In total, Investing.com reports 9 Buy signals, 1 Neutral signal, and 1 Sell signals, resulting in an overall Strong Buy technical rating. While some momentum indicators suggest caution after the recent rally, the broader technical structure continues to support a positive outlook for Beldex.
What Does the Beldex Price Depend On?
The price of Beldex changes constantly because it reacts to several market and project-specific factors. The most important drivers include:
- Overall crypto market sentiment – BDX often follows the direction of Bitcoin and the broader altcoin market.
- Ecosystem adoption – Greater use of products like BChat, BelNet, and Beldex Name Service (BNS) can increase demand for BDX.
- Supply and demand – More buyers than sellers generally push the price higher.
- Exchange listings and liquidity – New listings and higher trading volume can improve accessibility and attract investors.
- Regulatory developments – Privacy coins face additional regulatory risks that may affect investor confidence.
- Network upgrades and partnerships – New features, integrations, and technological improvements can strengthen long-term growth prospects and support higher valuations.
Beldex (BDX) Features
Beldex is more than just a privacy coin. The project is building a complete privacy-focused Web3 ecosystem designed to protect transactions, communication, browsing, and digital identity. Its main features include:
- Private transactions using technologies such as Ring Signatures, RingCT, and Stealth Addresses to hide sender, receiver, and transaction amounts.
- BChat, a decentralized messaging application that does not require a phone number or email registration.
- BelNet, a decentralized VPN that helps users browse the internet anonymously.
- Beldex Browser, designed to improve online privacy and resist tracking.
- Beldex Name Service (BNS), which replaces long wallet addresses with human-readable names.
- Proof-of-Stake and Masternodes, allowing users to stake BDX and help secure the network while supporting ecosystem services.
Correlation
Like most altcoins, Beldex is influenced by overall cryptocurrency market sentiment. Its price often follows Bitcoin and the broader market, although project-specific news can sometimes cause independent price movements.
Positively Correlated Cryptocurrencies
BDX is generally positively correlated with Bitcoin (BTC) and Ethereum (ETH) because they drive the overall crypto market. It also tends to move in the same direction as privacy-focused coins like Monero (XMR) and Zcash (ZEC).
Negatively Correlated Cryptocurrencies
Beldex does not have a strong long-term negative correlation with any major cryptocurrency. However, it can temporarily outperform or underperform the market when privacy coins attract more attention or when ecosystem developments create independent buying pressure.
How Beldex (BDX) Price Projection Works
Beldex price projections are created by combining technical analysis, historical price data, market trends, and fundamental factors. Analysts evaluate indicators such as moving averages, RSI, and trading volume while also considering ecosystem growth, adoption, and overall cryptocurrency sentiment.
Since crypto markets are highly volatile, forecasts should be viewed as possible scenarios rather than guarantees. Long-term price predictions become more reliable when supported by continued development and increasing real-world use of the Beldex ecosystem.
Bledex Price Prediction: Questions and Answers
Is BDX Coin a Good Investment?
BDX may appeal to investors seeking exposure to privacy-focused blockchain projects. However, like all cryptocurrencies, it remains a high-risk asset and should be evaluated alongside your risk tolerance.
Is Beldex Coin Safe?
Beldex uses privacy technologies and a Proof-of-Stake network to secure transactions. While the blockchain is secure, investing in BDX still carries market and regulatory risks.
What Is the Current Beldex Value?
At the time of writing, Beldex trades at approximately $0.088. The price changes continuously depending on market conditions and trading activity.
What Is the All-Time High of Beldex?
According to CoinGecko, Beldex reached its all-time high of approximately $0.4508 in 2018 during its early trading history.
What Is Beldex’s Price Prediction Today?
Most short-term models expect BDX to trade around $0.088-$0.09 today, with limited volatility unless the broader crypto market changes direction.
What Is Beldex’s Price Prediction for Tomorrow?
Current forecasts suggest another stable session, with BDX likely fluctuating close to $0.088-$0.09 if market conditions remain unchanged.
What Is the Beldex Price Prediction for This Week?
Technical models indicate BDX could remain between $0.086 and $0.092 this week as the market continues to consolidate.
What Is the Beldex Price Prediction for Next Week?
If bullish momentum continues, BDX may test nearby resistance levels around $0.09, although sideways trading remains the base scenario.
What Will the Price of Beldex Be Next Month?
DigitalCoinPrice forecasts July 2026 between $0.088 and $0.089, while PricePrediction estimates a wider range of $0.079-$0.097.
Will Beldex Go Up?
Beldex could appreciate if adoption of its privacy ecosystem grows and the overall cryptocurrency market remains bullish, but no outcome is guaranteed.
How High Can Beldex Go?
Long-term forecasts vary significantly. Conservative models target around $0.14 by 2030, while more bullish estimates exceed $0.57.
Will BDX Price Hit $0.2?
Yes, reaching $0.2 appears achievable under optimistic scenarios. PricePrediction expects BDX to exceed this level before 2030.
Will Beldex Coin Reach $1?
Reaching $1 would require substantial ecosystem growth and a much larger market capitalization. Current long-term forecasts do not project this level.
Will BDX Reach $10?
A price of $10 is extremely unlikely under current supply conditions and would require a market capitalization far beyond today’s largest cryptocurrencies.
Will Beldex Price Hit $50?
Based on the current circulating supply, $50 per BDX is not considered a realistic long-term target by mainstream forecasting models.
Will BDX Reach $100?
A price of $100 would imply an enormous valuation that is unrealistic under the current tokenomics and available long-term projections.
How Much Is BDX Worth in 2026?
DigitalCoinPrice forecasts $0.088-$0.098, while PricePrediction expects $0.09-$0.18, depending on market conditions.
What Is the Beldex Price Prediction for June 2026?
DigitalCoinPrice projects BDX to trade around $0.089, indicating a relatively stable month with limited volatility.
What Is the Approximate Beldex Price Prediction for Q3 2026?
For Q3 2026, forecasts range from $0.078 to $0.167, depending on the source and assumptions regarding market recovery.
How Much Is BDX Worth in 2027?
DigitalCoinPrice estimates $0.1-$0.12, while PricePrediction forecasts a broader range between $0.012 and $0.22.
How Much Is Beldex Worth in 2030?
Forecasts for 2030 range from $0.11-$0.14 according to DigitalCoinPrice and $0.27-$0.39 according to PricePrediction.
How Much Is Beldex Worth in 2040?
DigitalCoinPrice forecasts BDX between $0.19 and $0.2 by 2040 under a scenario of continued ecosystem expansion.
What Is the Long-Term Forecast for Beldex (2040, 2050 and beyond)?
DigitalCoinPrice estimates BDX could reach $0.19 by 2040 and $0.2 by 2050, assuming favorable long-term adoption trends.
What Role Does Market Sentiment Play in Beldex Price Predictions?
Market sentiment is one of the biggest drivers of BDX. Bullish crypto cycles can boost demand, while fear and uncertainty often lead to lower prices regardless of fundamentals.
Where to Buy BDX Coin
You can buy Beldex (BDX) on several cryptocurrency exchanges, including Kraken, KuCoin, and MEXC. If you prefer a wallet-to-wallet exchange without registration, StealthEX allows you to swap more than 2,000 cryptocurrencies directly into BDX while keeping full control of your funds.
How to Buy Beldex? Quick-Step Guide
Just follow these steps:
- Choose the crypto pair and enter the amount (for example, ETH to BDX).
- Click the “Start Exchange” button.
- Enter your Beldex wallet address.
- Send the funds to the provided deposit address.
- Receive BDX directly in your wallet.
That’s it. The entire process takes only a few minutes and does not require registration.
Follow us on Medium, X, Telegram, YouTube, and Publish0x to stay updated about the latest news on StealthEX.io and the rest of the crypto world.
Don’t forget to do your own research before buying any crypto. The views and opinions expressed in this article are solely those of the author.
BDX Beldex crypto price prediction cryptocurrency price predictionThe post Beldex (BDX) Price Prediction 2026, 2027-2030 first appeared on StealthEX.]]>
What Is Jupiter Exchange?
If you want to understand what is Jupiter Exchange, start with its purpose. Jupiter launched in 2021 as a solution to fragmented liquidity on Solana. Its mission is simple: deliver the best possible trade execution across all available DEXs. Instead of relying on one platform, it connects many.
Today, Jupiter dominates the ecosystem and handles more than 50% of total Solana DEX volume. Millions of users rely on it to trade faster and cheaper, which makes it a core layer of Solana DeFi.

How Jupiter Works?
To understand Jupiter DEX Solana, you need to see how aggregation works. Jupiter scans multiple decentralized exchanges like Orca or Raydium in real time. It compares prices, liquidity, and fees across them. Then it calculates the most efficient route for your trade. This route can include one or several swaps. The system also accounts for network costs and slippage. Once ready, Jupiter executes the trade directly from your wallet in a single transaction.
| Feature | Standard DEX (e.g., Raydium) | Jupiter Aggregator |
| Liquidity Source | Single Pool | Multiple Sources (All Solana DEXs) |
| Price Finding | Limited to one platform | Global Search across 20+ venues |
| Trade Path | Simple Swap (A to B) | Multi-hop Routing (A to C to B) |
| Slippage | Higher for large orders | Minimized via Split-trades |
| Fees | Platform standard fee | Optimized for total cost (including gas) |
Smart Routing System
Jupiter’s routing engine uses advanced algorithms to optimize every trade. It can split one order across multiple DEXs to reduce price impact. It also supports multi-hop routes, where one token swaps through intermediate assets to get a better rate.
For large trades, this approach helps minimize slippage and improve execution quality. The system always balances fees, liquidity, and speed to deliver the best outcome.
Key Features of Jupiter
Jupiter has grown far beyond basic swaps. Today, it acts as a complete DeFi platform, often described as a Jupiter perpetual exchange. Users can set limit orders to control entry prices instead of relying on instant execution. It also supports DCA strategies, which help reduce risk over time. In addition, Jupiter offers perpetual trading with leverage, giving access to advanced strategies. All features work inside one interface, so users avoid switching between multiple tools.
The JUP Token
The Jupiter exchange JUP token price reflects its role in the ecosystem. JUP launched in 2024 as a governance token designed to give users real influence. Holders can vote on upgrades, emissions, and key decisions. The token has a large circulating supply and quickly reached a strong market cap after launch. Its main purpose is to align the platform with its community and support long-term growth.
Tokenomics and Distribution
The Jupiter Exchange airdrop played a major role in distribution. The total supply was set at 10 billion tokens, with around 50% allocated to the community. A large portion was distributed through multiple airdrop waves known as “Jupuary.” Eligibility depended on past usage and on-chain activity.
The remaining tokens were assigned to the team, reserves, and ecosystem growth. Vesting schedules release tokens gradually, which helps control inflation and maintain stability.
| Category | Allocation Percentage | Key Purpose |
| Community Airdrops | 40% | Reward early users & adoption |
| Strategic Reserve | 20% | Ecosystem growth & incentives |
| Team & Contributors | 20% | Long-term development |
| Liquidity Provision | 10% | Market stability on CEX/DEX |
| Development Fund | 10% | Future protocol upgrades |
Jupiter Exchange on Solana
The strength of Jupiter Exchange Solana comes from the network itself. Solana offers near-instant finality, often under one second, and very low fees per swap. This allows Jupiter to execute complex routes without high costs.
The network also supports high throughput and parallel processing, which improves performance. Even during congestion, Jupiter remains efficient because it spreads activity across multiple liquidity sources.
How to Use Jupiter Exchange
If you want to learn how to use Jupiter Exchange, the process is simple.
- First, connect a supported wallet such as Phantom or Solflare.
- Then choose the tokens you want to swap and enter the amount. Jupiter will automatically find the best route. You can adjust slippage settings if needed.
- After that, confirm the transaction in your wallet.
- Finally, you can verify the trade on Solscan to ensure everything executed correctly.
Security and Safety
Many users ask is Jupiter Exchange safe, and the answer starts with its design. Jupiter is non-custodial, so users keep full control of their funds at all times. The platform relies on audited smart contracts and integrates with established Solana DEXs that have strong security track records.
Still, risks exist. Smart contract bugs, market volatility, and low liquidity on some pairs can affect trades. To stay safe, always verify URLs, use trusted wallets, and avoid signing unknown transactions.
Jupiter’s Performance and Statistics
Recent Jupiter Exchange updates show strong growth across all metrics. The platform has processed billions in total trading volume and consistently handles over 50% of Solana DEX activity. Daily volume often reaches hundreds of millions during active market periods.
Jupiter also serves millions of users and executes a large number of transactions every day. Over time, its market share has increased steadily, which confirms its role as a key infrastructure layer in Solana DeFi.
How to Buy JUP Tokens
If you want to access the Jupiter crypto exchange ecosystem, you can buy JUP on both centralized and decentralized platforms. Some major exchanges list JUP with pairs like JUP/USDT or JUP/USDC. You can also swap tokens directly on Jupiter itself using SOL or stablecoins.
Another option is StealthEX, which offers a simple and private way to buy JUP without account creation. You just select the pair, enter your wallet address, and complete the swap.
Step-by-step with StealthEX:
| Step | Action | Why StealthEX? |
| 1. Choose Pair | Select BTC/ETH to JUP | No registration required |
| 2. Enter Amount | Specify how much to swap | Competitive floating/fixed rates |
| 3. Provide Wallet | Enter your Solana (SOL) address | Non-custodial (your keys, your JUP) |
| 4. Confirm & Receive | Send funds & wait for swap | Fast processing & 24/7 support |
Frequently Asked Questions
Where Can I Find the Latest Jupiter Exchange News Today?
To stay updated with Jupiter exchange news today, follow official sources like X (Twitter), Discord, and the Jupiter blog. GitHub also shows development updates. Always verify links to avoid scams.
What Are the Jupiter Exchange Fees?
The Jupiter exchange fees depend on the route and liquidity source. Jupiter itself charges a small fee on some advanced features, while standard swaps mainly include DEX fees and Solana network costs. These fees are usually very low. The platform shows all costs before confirmation, which helps users compare options.
Is Jupiter Exchange Legit?
If you ask is Jupiter exchange legit, the data supports a positive answer. Jupiter dominates Solana trading volume and has a strong user base. It integrates with trusted protocols and maintains a transparent approach to development. While no DeFi platform is risk-free, its long track record and community trust support its legitimacy.
Conclusion
Jupiter has become a core part of the Jupiter decentralized exchange landscape on Solana. It simplifies trading, improves execution, and connects users to the best liquidity available. Its technology, combined with fast and cheap Solana transactions, gives it a strong advantage. The JUP token adds governance and aligns the platform with its users. If you want to get started, using tools like StealthEX makes buying JUP simple and accessible.
Follow us on Medium, X, Telegram, YouTube, and Publish0x to stay updated about the latest news on StealthEX.io and the rest of the crypto world.
Don’t forget to do your own research before buying any crypto. The views and opinions expressed in this article are solely those of the author.
crypto exchange JUP Jupiter Solana Solana blockchainThe post Jupiter Exchange: The Leading DEX Aggregator on Solana first appeared on StealthEX.]]>
What Is Litecoin? A Brief Overview
If you’re wondering what Litecoin is, think of it as a faster and more affordable version of Bitcoin that was built for everyday payments.
Created in 2011, Litecoin uses the Scrypt mining algorithm instead of Bitcoin’s SHA-256. This approach helps secure the network while keeping mining independent from Bitcoin.
One of Litecoin’s biggest advantages is speed. New blocks are confirmed every 2.5 minutes, making the network four times faster than Bitcoin, which produces a new block every 10 minutes. As a result, users usually receive transaction confirmations much sooner.
Litecoin also has a fixed maximum supply of 84 million coins, while Bitcoin is capped at 21 million. Despite these differences, Litecoin has maintained 100% network uptime for more than 14 years, making it one of the most reliable blockchain networks ever created.
Thanks to low transaction fees, fast settlements, and growing institutional interest, Litecoin remains one of the leading cryptocurrencies for everyday payments.
Litecoin vs. Bitcoin at a Glance
| Metric Component | Litecoin (LTC) Value | Bitcoin (BTC) Value | Strategic Crypto Portfolio Impact |
| Blockchain Block Time | 2.5 Minutes | 10 Minutes | Faster clearing for merchant micro-transactions |
| Max Circulating Supply | 84,000,000 LTC | 21,000,000 BTC | Four times the supply cap, designed as digital cash |
| Network Uptime History | 100% (Since 2011) | 100% (With minor early bugs) | Flawless institutional track record for custody |
| Major US Investment Vehicle | Canary Spot ETF (LTCC) | BlackRock iShares (IBIT) | Wall Street validation via retail brokerage access |
| Primary Real-World Use Case | BitPay Leader (Micro-payments) | Store of Value (Digital Gold) | LTC acts as the active spending layer of the market |
Litecoin Valuation Drivers in 2026: Beyond the Speculation
Litecoin’s valuation in 2026 depends on much more than market sentiment. Investors now watch institutional demand, on-chain activity, and Bitcoin’s performance alongside traditional price metrics.
As of late June 2026, Litecoin trades around $42, giving the network a market capitalization of roughly $3.2 billion. Despite losing about 45% year-to-date, LTC remains one of the largest and most liquid cryptocurrencies, supported by strong exchange availability and more than a decade of uninterrupted operation.
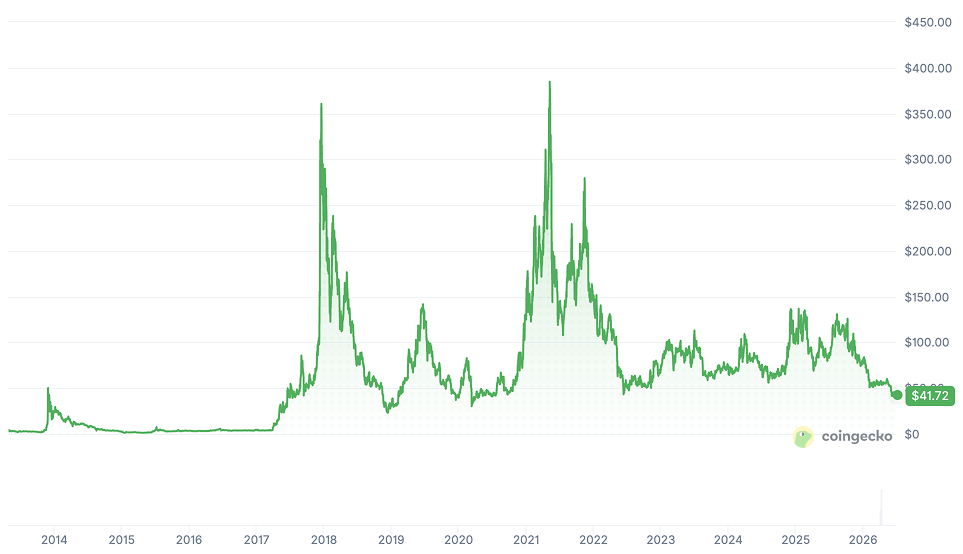
LTC Price Chart, CoinGecko, June 30, 2026
The biggest change this cycle is the launch of the Canary Litecoin ETF (LTCC). Although assets under management remain modest at around $5.5 million, the ETF gives institutions and retail brokerage clients regulated exposure to Litecoin for the first time.
Bitcoin still has the strongest influence on LTC, but that relationship is slowly evolving. ETF inflows create an additional source of demand that is independent of crypto exchanges, reducing Litecoin’s reliance on retail traders alone. As a result, any Litecoin price prediction for 2026 should consider both Bitcoin’s market cycle and the pace of institutional adoption, rather than focusing only on speculative momentum.
Technical Analysis: Support, Resistance, and On-Chain Metrics
Investing.com’s monthly technical data shows a weak short-term setup for Litecoin. The summary reads Strong Sell, with 12 moving averages and 8 technical indicators giving sell signals. RSI stands at 35.01, which shows weak momentum, while Stochastic, StochRSI, and Williams %R all sit in oversold territory. This means sellers still control the trend, yet a relief bounce can appear if buyers defend key levels.
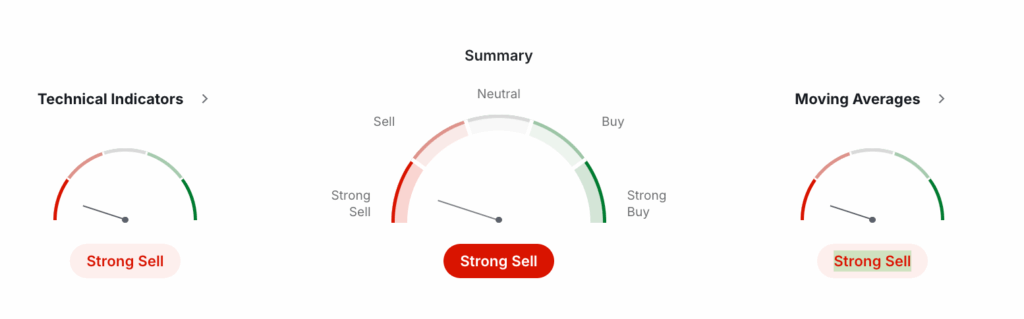
Investing, June 30, 2026
The main support zone sits near $48.07, followed by $44.1 and $37.85. If LTC loses these levels, the chart may stay under pressure. On the upside, resistance appears near $58.3, then $64.54 and $68.52. A clean move above these areas would improve the structure and make future Litecoin price predictions more constructive.
On-chain data gives a more balanced picture. BitInfoCharts shows 254,932 active Litecoin addresses in the last 24 hours, compared with 237,064 active addresses reported in February 2026, which suggests roughly 7.5% growth in active wallet activity despite weak price action.
Network usage also remains solid. BitInfoCharts reports 180,915 transactions in the last 24 hours, an average fee of only $0.0023, a median fee of $0.00038, and an average block time of 2 minutes 32 seconds. These figures support Litecoin’s payment-focused use case because users can still move value quickly and cheaply.
Security metrics are strong, but they need monitoring. BitInfoCharts places Litecoin hashrate near 2.53 PH/s, while CoinWarz shows the hashrate down 10.65% over 7 days and 14.22% over 30 days. That does not break the network thesis, but it shows that miner participation has cooled with the price.
The Post-ETF Reality: Wall Street’s Impact on LTC
The launch of the Canary Litecoin ETF (LTCC) marked a major turning point for Litecoin. LTCC began trading on Nasdaq in late October 2025 and became the first U.S. spot Litecoin ETF, giving investors exposure to LTC through a familiar brokerage product instead of a crypto exchange or private wallet. Canary’s own fund page lists Nasdaq as the exchange, an inception date of October 27, 2025, a 0.95% sponsor fee, and about $5.49 million in net assets as of June 29, 2026.
The approval path matters because LTCC did not appear in isolation. In September 2025, the SEC approved generic listing standards for commodity-based trust shares, including products that hold crypto asset commodities. Reuters reported that this change removed much of the old case-by-case review process and helped Canary launch Litecoin and Hedera products despite the SEC shutdown.
This gave the LTC ETF story more credibility. It also encouraged competition. Grayscale filed to convert its Grayscale Litecoin Trust into the Grayscale Litecoin Trust ETF, with NYSE Arca submitting a 19b-4 application in January 2025. That filing showed that major asset managers saw regulated Litecoin exposure as a serious product category, not just a short-term trade.
How Institutional Inflows Create a Supply Shock
A Litecoin spot ETF can create supply pressure because it must hold real LTC, not a paper claim. Canary’s holdings table showed 126,837.52 LTC held by LTCC on June 29, 2026. Compared with Litecoin’s circulating supply of about 77.33 million LTC, that equals roughly 0.16% of the market, so the current supply shock remains small.
The mechanism still matters. When ETF demand grows, authorized participants create new shares, the fund buys more LTC, and those coins move into custody. That can reduce liquid supply on exchanges and make price moves sharper during strong demand periods.
However, Litecoin is still far behind Bitcoin. U.S. spot Bitcoin ETFs recorded about $1.5 billion in net inflows in January 2024 alone, while LTCC sits near $5.49 million in net assets. This means Litecoin has the ETF structure, but not yet the Bitcoin-level flow engine.
Is Litecoin a Good Investment in 2026? Risk vs. Reward
So, is LTC a good investment in 2026? The answer depends on what you expect from it. Litecoin is not a high-growth smart contract platform like Solana, Ethereum, or newer Layer-1 networks. Instead, it is a liquid, battle-tested payment coin with deep exchange support, low fees, and a simple value proposition.
The bullish case is clear. Litecoin still has strong liquidity – LTC is near $3.2 billion in market cap and over $200 million in volume. BitPay’s 2025 report also shows LTC among the top five coins by payment volume and Litecoin as the fourth-largest payment network on its platform, which supports its real-world use case.
The risk is also real. Motley Fool argues that Litecoin faces pressure from Bitcoin’s Lightning Network and faster Layer-1 blockchains, while Cryptomus takes a more optimistic view and points to user growth, regular updates, and clearer regulation as potential support for LTC.
For beginners, Litecoin may work best as a smaller portfolio position, not a core holding. It offers stability and payment utility, but it needs stronger demand to outperform newer crypto networks.
Long-Term Network Outlook: The Scalability Roadmap
For investors asking whether Litecoin will go up, the stronger question is whether the network can stay useful. Litecoin’s roadmap focuses on practical payments, low fees, and optional privacy, not complex app ecosystems.
The key upgrade is MWEB, or MimbleWimble Extension Blocks. Litecoin activated MWEB in May 2022, and it lets users move LTC into a separate transaction layer where amounts can stay confidential. This gives Litecoin a privacy feature while keeping it optional for users and exchanges.
SegWit also matters. Litecoin activated SegWit in May 2017, which improved transaction efficiency and helped the network handle payments more smoothly.
Most importantly, Litecoin still keeps costs extremely low. BitInfoCharts recently showed an average Litecoin transaction fee near $0.0021–$0.0024, which supports its role as a fast payment network rather than a high-fee settlement chain.
The Role of Halving Cycles in Future Scarcity
Litecoin has a fixed supply cap of 84 million LTC, so its monetary policy becomes tighter over time. The block reward fell from 50 LTC to 25 LTC in 2015, then to 12.5 LTC in 2019, and to 6.25 LTC in 2023. The next halving should cut it to 3.125 LTC around 2027.
This scarcity does not guarantee instant gains. After past halvings, LTC often entered accumulation phases before stronger rallies appeared. That is why any Litecoin 2030 price prediction should focus on supply, demand, payments, and ETF adoption together, not on the halving alone.
How to Buy Litecoin on StealthEX
Buying Litecoin on StealthEX is straightforward because the platform works as a non-custodial crypto swap service. You do not need to create an account, complete registration, or leave funds on the platform. Instead, LTC goes directly to your personal wallet after the exchange.
- Select the trading pair you want to use, such as USDT to LTC, BTC to LTC, or ETH to LTC. Then enter the amount you want to exchange and review the estimated rate before continuing.
- Paste your personal Litecoin wallet address. This step matters because StealthEX does not hold your LTC in a user account. You keep control through self-custody and private key ownership.
- Confirm the transaction and send the deposit from your own wallet. StealthEX shows the exchange details before you start, so there are no hidden fund management fees or ongoing custody charges after the swap.
Litecoin Investment Access Methods
| Investment Vehicle Type | Management Fees (AUM) | Trading Structure | Custody Verification Method |
| US Spot Litecoin ETF (LTCC) | 0.95% Annual Sponsor Fee | Trades on Nasdaq (Intraday Liquidity) | Regulated Third-Party (Coinbase Custody / BitGo) |
| Legacy Over-The-Counter Trusts | Variable (Often 2.0%+) | Trades OTC (Risk of NAV Premium/Discount) | Internal Trust Vaults |
| Direct LTC Holdings via StealthEX | 0% Management Fees | Instant Non-Custodial Swap | True Self-Custody (Private Key Ownership) |
Conclusion: Navigating the Litecoin Market in 2026
Litecoin enters 2026 with a rare mix of history, liquidity, and new institutional access. Its network remains stable, its fees stay low, and the LTCC ETF gives traditional investors a regulated path to LTC exposure. Payment adoption also supports its real-world use case, especially for fast and low-cost transfers. Still, Litecoin faces strong competition from newer blockchains, so the question of whether I should invest in Litecoin depends on risk tolerance. For most beginners, LTC may fit best as a smaller, diversified crypto position rather than an all-in bet.
Frequently Asked Questions About Litecoin Investment and ETFs
What Is a US Spot Litecoin ETF and How Does It Differ From Existing Crypto Trusts?
A spot ETF holds actual LTC and trades intraday on a regular exchange. Grayscale’s Litecoin Trust gives LTC exposure too, but OTC trusts can trade with premiums or discounts. Spot ETFs usually track LTC more cleanly.
Will Litecoin Reach $1000?
At $1,000, Litecoin would need a market cap near $77 billion based on its current circulating supply. That would likely require major ETF inflows, a broad crypto bull market, and stronger payment adoption. Probability before 2030: low.
Does Litecoin Have a Future Beyond 2026?
Yes, Litecoin has a future if users keep valuing fast, cheap payments. Its strengths are uptime, liquidity, and near-zero-cost transfers, but it must compete with newer Layer-1s and Bitcoin payment rails.
Why Is Litecoin Going Up in 2026?
When Litecoin rises, key drivers include ETF demand, Bitcoin rally spillover, adoption news, and technical breakouts from oversold levels. LTC still follows Bitcoin often, but ETF access can add independent demand.
How Can I Use Dollar-Cost Averaging to Invest in Litecoin?
Dollar-cost averaging means buying a fixed amount on a schedule, such as $50 weekly. If LTC trades near $50, four weekly buys equal about 4 LTC monthly. This reduces timing risk and emotional decisions.
Make sure to follow StealthEX on Medium, X, Telegram, YouTube, and Publish0x to stay updated about the latest news on StealthEX and the rest of the crypto world.
Don’t forget to do your own research before buying any crypto. The views and opinions expressed in this article are solely those of the author.
crypto price prediction cryptocurrency Litecoin LTC price analysisThe post Litecoin Price Analysis & ETF Outlook for 2026 first appeared on StealthEX.]]>

Understanding Altcoin Season
Definition of Altcoin Season
Many beginners wonder what altcoin season is and why it attracts so much attention from crypto investors.
Altcoin season is a market phase in which 75% or more of the top 50 cryptocurrencies outperform Bitcoin over a rolling 90-day period. Analysts use this benchmark to measure whether capital is flowing away from BTC and into alternative digital assets.
The term became widely known during the 2017-2018 bull market, when thousands of investors shifted profits from Bitcoin into Ethereum and smaller cryptocurrencies. As a result, many altcoins generated returns several times higher than BTC within a few months.
Historically, a full altcoin season has lasted between two and six months, although every cycle follows its own pace.
Outperformance simply means an altcoin delivers a better return than Bitcoin over the same period. For example, if Bitcoin gains 25% in 90 days while Solana rises 80%, Solana has outperformed BTC by a wide margin. When most leading cryptocurrencies achieve similar results, the market is generally considered to be in altseason.
The Bitcoin vs. Altcoins Dynamics: The ETF Wall
Bitcoin dominance represents the percentage of the entire cryptocurrency market that belongs to Bitcoin. When this metric starts falling, investors often interpret it as a sign that money is moving into altcoins.
However, the current market cycle differs from previous ones because of the so-called ETF Wall.
Spot Bitcoin ETFs launched by asset managers such as BlackRock and Fidelity have attracted billions of dollars from institutional investors. Unlike crypto traders, these investors usually gain exposure only to Bitcoin through regulated financial products, leaving that capital effectively locked inside the BTC ecosystem.
During the 2017 rally, retail money flowed much more freely into thousands of altcoins. In 2026, a broad altseason may require both Bitcoin profit-taking and a fresh wave of retail and on-chain liquidity before capital can spread across the wider market.
| Feature | Classic Cycle (2017–2021) | Institutional Cycle (2025–2026) |
| Primary Inflow | Retail / Fiat-to-Exchange | Institutional / Spot ETFs & RWA |
| Capital Flow | Linear: BTC → ETH → Large Caps → Small Caps | Fragmented: BTC → Specific Narratives (AI/DePIN) |
| The “ETF Wall” | Non-existent (capital flows freely) | High (ETF capital is “locked” in BTC/ETH) |
| Market Driver | Social Media / Pure Speculation | Real Utility / Enterprise Adoption / Layer 2 Growth |
How to Identify Alt Season
Recognizing alt season early can make a huge difference, as entering after the biggest rally often increases risk and limits upside potential.
The Altcoin Season Index & New 2026 Metrics
The Altseason Index is one of the most popular tools for tracking market rotation. Developed by Blockchaincenter, it uses a scale from 0 to 100 based on the performance of major cryptocurrencies against Bitcoin over the previous 90 days.
A reading below 25 signals Bitcoin season, while values between 25 and 75 suggest a mixed market. When the index rises above 75, the market is generally considered to be in altcoin season because most leading altcoins outperform BTC.

Altcoin Season Index, BlockchainCenter, June 10, 2026
However, the 2026 market requires additional confirmation. Many analysts now monitor the ETH/BTC and SOL/BTC trading pairs alongside the index. If Ethereum and Solana fail to gain strength against Bitcoin, an index reading above 75 may simply reflect temporary speculation rather than a sustainable market rotation. Strong performance from these benchmark pairs often confirms that capital is flowing beyond Bitcoin into the broader ecosystem.
| Index Value | Market Phase | Market Sentiment | Key Indicators (2026 Focus) |
| 0–25 | Bitcoin Season | Fear / Consolidation | BTC Dominance rising; ETH/BTC ratio at local lows |
| 25–75 | Mixed / Transition | Neutral / Anticipation | Capital rotation begins; Sector-specific rallies (AI, RWA) |
| 75–100 | Altcoin Season | Extreme Greed / FOMO | 75% of Top 50 alts outperform BTC; ETH and SOL breakout |
Key Indicators and Metrics
No single altcoin season indicator can predict the market with perfect accuracy. Instead, experienced investors combine several signals before concluding that a new rotation has begun.
One of the strongest indicators is Bitcoin dominance. A decline from above 50% toward 40% or lower often suggests that capital is leaving BTC and entering altcoins. At the same time, the total altcoin market capitalization should expand much faster than Bitcoin’s market value, ideally growing two to three times faster over the same period.
Trading activity also provides valuable clues. A week-over-week increase of more than 50% in altcoin/BTC trading volume usually signals rising investor interest. Social media engagement and Google Trends can reinforce this picture, especially when searches for terms like “best altcoins” or “altcoin season” increase by more than 30-50% within a few weeks.
When several of these indicators align, the probability of a genuine altseason becomes significantly higher than relying on the Altcoin Season Index alone.
Historical Altcoin Rally Patterns
Every major altcoin rally leaves valuable lessons behind, helping investors recognize repeating trends and avoid emotional decisions during future market cycles.
2017-2018 and 2020-2021 Bull Runs
Although both cycles produced extraordinary gains, the forces behind them were very different.
The 2017-2018 altcoin season was fueled by the ICO boom. Hundreds of new blockchain projects raised capital directly from retail investors, creating an environment where speculation often mattered more than fundamentals. As Bitcoin reached new highs and then slowed down, money rapidly rotated into smaller cryptocurrencies, causing many tokens to surge several hundred percent within months.
The 2020-2021 cycle followed a different path. Instead of ICOs, the market focused on DeFi protocols, NFT platforms, Layer 1 blockchains, and later meme coins. At the same time, institutional investors entered crypto through companies, funds, and regulated investment products, bringing significantly more capital than in previous years.
Retail investors still played a major role, especially during the NFT and meme coin frenzy, but institutional participation made the market larger and more mature. This shift also changed capital rotation, making leadership by Ethereum and key sectors more important than broad market speculation. As a result, future altcoin seasons may become increasingly selective rather than lifting every project at the same time.
Phases of Altcoin Season: From BTC to Narratives
The modern altcoin cycle is no longer a period where every token rises together. Capital now rotates from one narrative to another, rewarding sectors with the strongest adoption and momentum. Understanding these phases helps investors identify where money is flowing instead of chasing projects that have already peaked.
| Phase | Core Signal | Trending Sectors | Strategic Action |
| Pre-Season | BTC sideways, Alt/BTC pairs bottoming | Blue-chip alts (ETH, SOL) | Accumulate quality projects via StealthEX |
| Early Season | Sector-specific breakouts | AI, RWA, Layer 2 Solutions | Focus on leaders; avoid laggards |
| Peak Season | 100%+ gains in small caps | Meme Coins, New Launches | Take profits; move to stablecoins or BTC |
Pre-Season (Accumulation Phase)
The accumulation phase often begins while Bitcoin moves sideways or corrects by around 10-20%. During the same period, many altcoins fall another 20-40% from their local highs, causing retail interest to disappear.
Trading volume remains low, social media activity declines, and negative sentiment dominates discussions. Behind the scenes, experienced investors gradually accumulate projects with strong fundamentals at discounted prices.
This phase often ends when Bitcoin stabilizes, Ethereum starts outperforming BTC, and trading volume slowly returns. For long-term investors, this is usually the best time to research projects, build a watchlist, and accumulate positions before broader market attention returns.
Early Season: Narrative-Led Breakouts
Many investors ask, when does altcoin season start? In today’s market, the answer is often tied to narratives rather than market capitalization.
Instead of all top-ten cryptocurrencies rallying together, capital first flows into sectors attracting the strongest attention. AI agents, Real World Assets (RWA), and DePIN projects have recently become leading examples of this trend.
The traditional strategy of buying the largest altcoins simply because they rank in the top ten has become less effective. Early winners are increasingly projects with clear use cases, growing ecosystems, and strong investor narratives that attract fresh liquidity before the rest of the market reacts.
Peak Season (Maximum Activity)
The question is whether altseason becomes common when mid-cap and small-cap cryptocurrencies start gaining 100-500% within a few weeks. At this stage, optimism reaches extreme levels, and the Fear & Greed Index often climbs above 80.
While retail investors aggressively buy every market dip, experienced traders frequently begin distributing their holdings and securing profits. New token launches explode, leverage increases, and social media fills with unrealistic price predictions.
These conditions often serve as warning signs rather than buying opportunities. Rising volatility, excessive leverage, and parabolic price moves usually indicate that the market is approaching exhaustion. Historically, this peak phase lasts between two and six weeks before a sharp correction or a broader market rotation begins.
Trading Strategies for Altcoin Season
Successful altcoin investing depends on a clear plan. A structured strategy helps investors manage risk, protect profits, and avoid emotional decisions during volatile market conditions.
Portfolio Allocation & Sector Rotation
A balanced portfolio should match both your risk tolerance and market conditions. Conservative investors often allocate more capital to Bitcoin, Ethereum, and stablecoins, while aggressive traders increase exposure to high-growth sectors during strong market momentum.
Sector rotation is equally important. Capital rarely stays in one narrative for an entire cycle. For example, profits earned from AI-related projects can later move into RWA, DePIN, gaming, or other emerging sectors as investor attention shifts. Following liquidity instead of chasing past winners often produces better long-term results.
| Portfolio Style | BTC / ETH | Mid-Cap Alts (AI/RWA) | Small-Cap / Speculative | Risk Level |
| Conservative | 70% | 20% | 10% | Low–Moderate |
| Moderate | 50% | 35% | 15% | Moderate |
| Aggressive | 30% | 40% | 30% | High |
StealthEX: Cross-Chain Rotation in 2026
One of the biggest advantages during altcoin season is the ability to move capital quickly between ecosystems. New trends often emerge on different blockchains, and waiting too long can mean missing the strongest part of the rally.
StealthEX simplifies this process through instant cross-chain swaps. Instead of using multiple exchanges, bridges, and wallets, users can exchange Ethereum-based assets directly for trending tokens on Solana, Base, or many other networks in a single transaction.
This approach removes much of the complexity associated with traditional bridging solutions while allowing traders to react quickly as narratives change. For investors following sector rotation, fast cross-chain execution can become a significant competitive advantage during periods of high volatility.
Risk Management & Stop-Loss Discipline
Even the strongest altcoin season eventually comes to an end, making risk management one of the most important parts of any strategy.
Many experienced investors limit each position to 5-10% of their portfolio, reducing the impact of a single unsuccessful trade. Diversification across 8-12 carefully selected projects can further lower overall portfolio risk while maintaining exposure to multiple narratives.
Holding part of a portfolio in stablecoins also provides flexibility. Stablecoin reserves allow investors to buy quality assets during corrections and protect profits when market conditions become overheated. Combined with predefined stop-loss levels and profit targets, this disciplined approach often delivers more consistent results than trying to maximize gains on every trade.
Altcoin Season vs Bitcoin Season
Understanding bitcoin season and the transition to altcoin season helps investors recognize market rotation and adapt their strategy before capital changes direction.
Key Differences and Rotation Signals
The difference between altcoin season and BTC season comes down to where capital is flowing. During Bitcoin season, BTC dominance usually climbs above 50-60%, showing that investors prefer the market’s largest and most established asset. At the same time, many altcoins underperform or lose value against Bitcoin, even if their prices remain stable in dollar terms.
Altcoin season tells the opposite story. Bitcoin dominance often falls toward 40% or lower, while Ethereum and other major cryptocurrencies begin attracting more liquidity. This rotation can eventually spread to mid-cap and small-cap projects, creating the strongest gains of the cycle.
The investor profile also changes. Bitcoin season tends to attract conservative investors and institutions seeking lower volatility and long-term exposure. Altcoin season brings more speculative capital, with traders accepting higher risk in exchange for the possibility of significantly larger returns.
Historically, Bitcoin-led phases often last several months, while intense altcoin rallies may continue for only two to six weeks before momentum fades. Watching BTC dominance is therefore essential. If dominance starts rising again, stablecoin inflows increase, and leading altcoins begin losing strength against Bitcoin, these are often early signs that capital is rotating back into BTC or defensive positions, signaling the end of the altcoin cycle.
Expert Predictions and Future Outlook for the Altcoin Season
While every forecast remains uncertain, understanding predictions altcoin and their key catalysts can help investors build a smarter long-term strategy.
When Will the Next Altcoin Season Start
Many investors ask, when will altcoin season start, but no indicator can provide an exact date. Instead, successful predictions rely on a combination of macroeconomic conditions, Bitcoin’s market cycle, and capital rotation.
Historically, the strongest altcoin rallies have developed 18 to 30 months after a Bitcoin market bottom, often following a halving event. Since the latest Bitcoin halving took place in April 2024, many analysts believe the 2026-2027 period could still provide favorable conditions if liquidity continues improving.
Macroeconomic factors will play a major role. Lower interest rates, expanding global liquidity, and stronger investor risk appetite could encourage capital to flow into higher-risk digital assets. Institutional adoption may also support the market, although a significant share of investment remains concentrated in Bitcoin ETFs rather than altcoins.
Technology will likely shape the next cycle as much as macroeconomics. Narratives such as AI infrastructure, Real World Asset tokenization, DePIN, next-generation DeFi, and blockchain gaming could become the primary destinations for fresh capital. Rather than expecting every cryptocurrency to rally together, investors should focus on sectors attracting real users, developer activity, and institutional attention.
When Will Altcoin Season Start in 2026
The officially confirmed 2026 altcoin season has not yet begun, as Bitcoin currently accounts for approximately 56-60% of the total market capitalization. Analysts predict that a sustained shift toward altcoins will only occur if Bitcoin’s dominance falls below 50-55% and the Altcoin Season Index reaches the 75 threshold.
How to Prepare for the Next Altcoin Season
Preparing during quiet markets often creates better opportunities than reacting after prices have already exploded. A solid plan allows investors to act with confidence when momentum returns.
Building a Watchlist
The best watchlists focus on quality instead of quantity. Before adding a project, investors should confirm that it has a working product, active users, an experienced and publicly known development team, a reasonable valuation, and a strong community supporting long-term growth.
A practical research checklist should include token utility, ecosystem activity, developer updates, partnerships, liquidity, tokenomics, and competitive advantages. Reviewing these factors regularly makes it easier to separate lasting projects from short-term hype.
Organizing a watchlist by market capitalization, sector, and risk level also improves decision-making. Large-cap assets can provide stability, while smaller projects may offer higher upside with greater volatility. Updating the watchlist weekly and performing a deeper review each month helps investors stay prepared before capital rotates into new narratives.
Setting Up Your Trading Infrastructure
Strong infrastructure becomes a competitive advantage during fast-moving markets. Centralized exchanges usually provide deep liquidity and fiat access, while decentralized exchanges offer direct on-chain trading and access to newly launched tokens.
StealthEX combines many of these advantages by giving users access to more than 2,000 cryptocurrencies through instant swaps without mandatory KYC for standard transactions. Its cross-chain functionality also allows traders to move quickly from Ethereum assets into trending Solana, Base, or other ecosystem tokens without dealing with complex bridges.
Security should remain a priority regardless of platform choice. A hot wallet is useful for active trading, while a hardware wallet offers stronger protection for long-term holdings. Investors should also back up recovery phrases offline, enable two-factor authentication, verify wallet addresses before every transfer, and avoid storing large amounts of crypto on exchanges for extended periods.
Frequently Asked Questions
What Is the Current Altcoin Season Index Value?
The Altcoin Season Index’s current value can be checked in real time at Blockchaincenter. A score of 0-25 indicates Bitcoin season, 25-75 signals a mixed market, and 75-100 suggests altseason. Although the index updates daily, checking it weekly usually provides clearer signals and helps avoid overtrading caused by short-term market noise.
When Is Alt Season?
Many investors ask when alt season is, but there is no fixed date. Historically, major altcoin rallies have often appeared 12-18 months after a Bitcoin halving. While the latest halving took place in April 2024, market conditions, Bitcoin dominance, liquidity, and ETH/BTC strength remain more important than the calendar itself.
Can an Altcoin Season Happen if Bitcoin Is Crashing?
No. Broad altcoin seasons require Bitcoin to remain stable or trend higher. When Bitcoin falls more than 20% in a short period, capital usually leaves the entire crypto market instead of rotating into altcoins. Historically, major altcoin rallies have developed during Bitcoin consolidation or moderate uptrends, with only minor exceptions during small BTC pullbacks.
When Will Altcoins Pump?
The answer to when altcoins will pump usually depends on market rotation. Altcoins often accelerate after Bitcoin dominance peaks above 50-55% and starts declining while the ETH/BTC ratio strengthens. A 15-30% gain in ETH/BTC frequently precedes a broader rally, with capital gradually flowing from Ethereum into large-cap, mid-cap, and finally smaller altcoins.
Follow us on Medium, X, Telegram, YouTube, and Publish0x to stay updated about the latest news on StealthEX.io and the rest of the crypto world.
Don’t forget to do your own research before buying any crypto. The views and opinions expressed in this article are solely those of the author.
altcoin altcoin season altcoins Bitcoin what is altcoinThe post Altcoin Season Index: Complete Guide for 2026 first appeared on StealthEX.]]>

Best Cheap Crypto with Potential in 2026: Detailed Analysis
Investors who search for the cheapest cryptocurrency often ignore fundamentals. This section focuses on affordable coins with real value. Selection depends on strong technology, legitimate use cases, and expanding ecosystems. Each project trades on major exchanges, including StealthEX. The goal centers on value investing, not price chasing. Cheap tokens alone do not create opportunity. Sustainable networks with adoption and clear catalysts do.
| Crypto Name | Current Price | Market Cap | Category | Key Use Case | 2026 Catalyst |
| XRP | $1.5 | $91B | Payment Network | Bank cross-border settlement | SEC clarity, Ripple USD growth |
| ADA | $0.28 | $10B | L1 Blockchain | Smart contracts, DeFi | Chang upgrade, Hydra scaling |
| XLM | $0.17 | $5.5B | Payment Network | Remittances, tokenization | USDC expansion, partnerships |
| TRX | $0.28 | $26.5B | L1 Blockchain | Stablecoin transfers | USDT dominance, low fees |
| VET | $0.008 | $720M | Supply Chain | Enterprise logistics tracking | Global adoption programs |
| HBAR | $0.1 | $4.3B | Enterprise Blockchain | Tokenization infrastructure | Council expansion |
| ALGO | $0.09 | $850M | L1 Blockchain | DeFi, CBDC rails | State proofs rollout |
| GRT | $0.03 | $300M | Infrastructure | Blockchain indexing | Multi-chain growth |
| POL | $0.1 | $1.1B | L2 Scaling | Ethereum scaling | zkEVM adoption |
| ARB | $0.11 | $651M | L2 Scaling | Rollup infrastructure | DeFi ecosystem growth |
| SUI | $0.97 | $3.7B | L1 Blockchain | High-speed apps | Parallel execution expansion |
| FET | $0.17 | $400M | AI + Blockchain | Autonomous AI agents | Enterprise AI integration |
XRP (Ripple)
XRP trades around $1.5 in February 2026 with a market cap near $91B, which keeps it among the largest coins to invest in by liquidity and global reach. The project focuses on cross-border payments for banks and financial institutions. XRP solves a clear problem. Traditional international transfers stay slow and expensive. RippleNet allows institutions to settle transactions in seconds with minimal fees. The system uses ODL, or On-Demand Liquidity, which removes the need for pre-funded foreign accounts and reduces capital friction.
Ripple Labs leads development under CEO Brad Garlinghouse, while co-founder Chris Larsen remains a key strategic figure. The company maintains partnerships with major banks and payment providers across multiple regions. Recent milestones include the resolution of the long SEC legal dispute and the launch of the Ripple USD stablecoin, which expands ecosystem utility. The 2026 roadmap targets CBDC partnerships and institutional custody infrastructure. These upgrades may strengthen adoption and act as price catalysts if bank usage accelerates.
XRP behaves like financial infrastructure rather than a speculative token. Liquidity stays deep and access remains broad. Beginners can acquire XRP through non-custodial swaps on StealthEX without leaving funds on centralized exchanges. However, volatility still exists. Long-term value depends on real institutional adoption, regulatory clarity, and network usage rather than short-term hype.
Cardano (ADA)
Cardano trades near $0.28 in February 2026 with a market cap around $10B, which places ADA in the conversation about low cap crypto with large ecosystem potential. Cardano operates as a Layer 1 blockchain built for smart contracts and decentralized finance. The project aims to create a secure, scalable base layer using academic research rather than rapid iteration. Its Ouroboros proof-of-stake consensus reduces energy use while maintaining decentralization. This design attracts developers who prioritize long-term stability.
Charles Hoskinson founded Cardano, and Input Output Global continues to lead core development. The team follows a scientific review model, which separates Cardano from faster but less formal chains. Partnerships in Africa, including Ethiopia’s education credential system, show real-world experimentation. DeFi protocols continue to launch across the ecosystem, which increases on-chain activity. Recent upgrades include the completed Chang hard fork, the Hydra scaling layer going live, and the Midnight privacy sidechain entering production. These milestones expand performance and functionality.
The 2026 roadmap centers on governance maturity and DeFi total value locked growth. Institutional DeFi adoption and real-world applications may act as price catalysts if network usage expands. Beginners can buy ADA through non-custodial swaps on StealthEX while keeping custody of funds. However, ADA still follows market volatility. Long-term value depends on adoption, developer activity, and sustained ecosystem growth rather than short-term speculation.
Hedera (HBAR)
HBAR trades near $0.1 in February 2026 with a market cap around $4.3B, which keeps Hedera visible as a new crypto to invest in for investors who focus on enterprise infrastructure. Hedera does not use a traditional blockchain. The network runs on the Hashgraph consensus algorithm, which delivers high throughput above 10,000 transactions per second and extremely low fees. This architecture targets corporate environments that require speed, predictability, and compliance.
The Hedera Governing Council includes companies such as Google, IBM, Boeing, LG, and Deutsche Telekom. This structure distributes control across global organizations rather than a single foundation. Use cases already extend into asset tokenization, supply chain tracking, and carbon credit markets. Recent milestones include the DLA Piper tokenization platform and Shinhan Bank’s stablecoin pilot, which signal institutional experimentation on live infrastructure.
The 2026 roadmap focuses on a broader tokenization wave and the rollout of Smart Contracts 2.0 for advanced enterprise logic. Fortune 500 integrations and adoption announcements may act as price catalysts if real usage expands. Hedera positions itself as infrastructure for regulated industries rather than retail speculation.
Beginners can access HBAR through non-custodial swaps on StealthEX while keeping custody of assets. However, enterprise crypto still carries volatility. Long-term value depends on sustained corporate adoption, not hype.
The Graph (GRT)
GRT trades near $0.03 in February 2026 with a market cap around $300M, which places The Graph among infrastructure projects often discussed as a crypto with most potential in Web3 data services.
The Graph operates as a decentralized indexing protocol that allows developers to query blockchain data efficiently. Many describe it as a search engine layer for blockchains. Instead of scanning raw chains, applications pull structured data through subgraphs. These subgraphs support Ethereum, Polygon, Arbitrum, and other major ecosystems.
Co-founders Yaniv Tal and Brandon Ramirez built The Graph to solve a real developer bottleneck. Accessing blockchain data remains slow without indexing. Recent upgrades expanded multi-chain support to Solana, NEAR, and Cosmos. The protocol also integrates AI-powered query optimization, which improves efficiency as datasets grow. The 2026 roadmap targets more than 50 blockchain integrations and an AI agent data access layer. These upgrades align with the convergence between AI and decentralized infrastructure.
Demand for GRT scales with Web3 adoption. Every new decentralized application increases indexing needs. This structural demand may act as a long-term price catalyst if the ecosystem expands. Beginners can acquire GRT through non-custodial swaps on StealthEX while retaining custody. However, infrastructure tokens remain volatile. Value depends on sustained developer activity and DApp growth, not speculation.
Artificial Superintelligence Alliance (FET)
FET trades near $0.17 in February 2026 with a market cap around $400M, which places it among the best altcoins for next bull run discussions tied to AI infrastructure.
Artificial Superintelligence Alliance (prev. Fetch.ai) sits at the intersection of artificial intelligence and blockchain. The network deploys autonomous economic agents that use machine learning to perform tasks without human control. These agents support real-world scenarios such as supply chain optimization, automated DeFi trading, and smart city logistics. The goal centers on creating decentralized AI services that operate across industries.
CEO Humayun Sheikh leads development and focuses on enterprise adoption. Strategic partnerships include Bosch and Deutsche Bahn, which highlight industrial experimentation with AI agents. A major milestone arrived through the ASI Alliance merger with SingularityNET and Ocean Protocol. This union forms a combined AI ecosystem valued near $7.5B and expands shared infrastructure. The 2026 roadmap emphasizes enterprise AI agent deployments and a decentralized machine learning marketplace that connects developers and businesses.
FET benefits from the broader AI boom. Demand for decentralized compute and automation may act as a strong catalyst if enterprise partnerships scale. Integration within the ASI token framework also increases ecosystem visibility. Beginners can acquire FET through non-custodial swaps on StealthEX while maintaining asset control. However, AI tokens remain volatile. Long-term value depends on real adoption and usable technology, not hype.
How to Buy Low-Priced Cryptocurrencies Safely
Many beginners look for the cheapest crypto to buy without thinking about safety. Low-priced coins attract attention, yet secure purchasing matters more than entry cost. In 2026, investors use a mix of centralized exchanges, decentralized platforms, and instant swap services like StealthEX. Each option carries different risks. Hardware wallets protect long-term holdings. Users should avoid phishing links and always verify contract addresses before sending funds. Safe habits reduce costly mistakes.
Using StealthEX for Cheap Crypto Purchases
People who ask where to buy cheap crypto often want speed, privacy, and simplicity. StealthEX operates as a non-custodial instant exchange. The platform never holds user funds. Every swap runs wallet-to-wallet. This design removes exchange custody risk and reduces exposure to hacks. Users do not need registration or KYC. StealthEX supports more than 2,000 cryptocurrencies and over 100 fiat payment methods. Most swaps complete in under fifteen minutes depending on network conditions.
The process stays simple and beginner-friendly. First, go to StealthEX website and select the crypto pair you want to swap.

Second, enter your receiving wallet address.

Third, send the deposit transaction. Fourth, receive your coins directly in your wallet.

No account creation exists, and the platform stores no personal data. This structure increases privacy and limits attack surfaces. Integration partners can customize fees, while users choose between fixed-rate and floating-rate options depending on market preference.
StealthEX focuses on trust through transparency. Rates appear before confirmation, and the system locks fixed swaps during execution. Floating swaps adjust with market movement. Because StealthEX never controls private keys, users maintain full ownership at every step. That principle aligns with core crypto security philosophy.
Decentralized Exchanges (DEXs)
DEXs remain essential for new crypto coins to invest in because they list tokens before centralized exchanges.
- Uniswap dominates the Ethereum ecosystem.
- PancakeSwap offers low fees on BNB Chain.
- Raydium provides high-speed swaps on Solana.
- Aerodrome serves as the native liquidity hub on Base.
To trade, users connect wallets such as MetaMask, Phantom, or Rabby. The swap process is easy: connect wallet, select pair, approve token, set slippage between 0.5% and 2%, then confirm the transaction.
Gas fees vary by network congestion. Investors reduce cost by using Layer 2 networks when possible. DEX access brings opportunity but also risk.
- New tokens may lack audits.
- Rug pulls still occur.
- Impermanent loss affects liquidity providers.
Aggregators like 1inch and Jupiter help users find optimal pricing across multiple pools, yet risk never disappears.
| DEX Name | Supported Chains | Avg Gas Fees | Liquidity | Best For |
| Uniswap | Ethereum, L2s | $2–15 ETH / <$1 L2 | Very High | Established tokens |
| PancakeSwap | BNB Chain | <$1 | High | Low-fee trading |
| Raydium | Solana | <$0.1 | Medium | Fast swaps |
| Aerodrome | Base | <$1 | Growing | Base ecosystem |
| 1inch | Multi-chain | Variable | Aggregated | Best routing |
| Jupiter | Solana | <$0.1 | Aggregated | Solana routing |
Investment Strategies for Cheap Cryptocurrencies
Anyone searching for the best crypto to buy now should think about strategy before thinking about price. Cheap assets move faster than large caps, so position sizing and timing matter more than entry hype.
The 2026 market sits in a classic post-halving expansion phase. Historically, Bitcoin leads first, Ethereum follows, large-cap altcoins come next, and smaller coins move last. This rotation does not happen overnight, yet it repeats often enough to guide expectations.
Investors who chase late pumps usually carry the most risk, while investors who scale in early and manage size survive volatility better. Cheap crypto rewards patience, not impulse. Entry points matter, but timeframe matters more. A 12–18 month horizon fits the current cycle better than short-term speculation.
Portfolio Allocation Guidelines
People looking for a small crypto to invest often forget portfolio balance. Crypto should usually represent 5–10% of a total portfolio, not the entire strategy. Within that crypto portion, speculative low-cap plays should stay limited to 10–20% of the crypto allocation, which equals roughly 1–2% of total net worth. This structure forms a risk pyramid. The base layer holds Bitcoin and Ethereum at about 60–70% because they anchor stability. The middle tier includes established altcoins such as XRP, ADA, HBAR, and ALGO at 20–30%. The top tier contains higher-risk growth projects like GRT, FET, ARB, and SUI.
Diversification inside the cheap crypto segment also matters. Layer 1 chains behave differently from infrastructure tokens or AI protocols. Spreading exposure across sectors reduces single-theme risk. Conservative investors often stick to the top 20 assets and size positions smaller. Aggressive investors explore lower caps but accept deeper swings. The 2026 environment will likely remain volatile even in bullish phases, so position sizes should reflect emotional tolerance as much as financial capacity.
| Risk Level | % of Portfolio | Crypto Type | Example Projects |
| Conservative | 3–5% | Large-cap core | BTC, ETH |
| Moderate | 5–8% | Established alts | XRP, ADA, HBAR, ALGO |
| Aggressive | 8–10% | Emerging growth | GRT, FET, ARB, SUI |
| Speculative | ≤2% | Micro-cap bets | Early-stage projects |
Dollar-Cost Averaging (DCA)
For beginners searching for the best crypto to buy now, dollar-cost averaging offers one of the safest entry methods. DCA means investing a fixed amount at regular intervals regardless of price. Instead of trying to predict perfect bottoms, investors spread purchases across time.
This method reduces timing risk and smooths volatility. It also removes emotional pressure, which often leads to bad decisions during sharp drops. In a post-halving cycle like 2026, predicting exact tops and bottoms becomes nearly impossible, so consistency beats precision.
A simple example helps. Imagine investing $100 per month into XRP across four months while price swings up and down. The final average purchase price often lands lower than a single lump-sum entry. Over time, this effect compounds.
XRP DCA Example – 2026
| Month | Investment Amount | XRP Price | Tokens Purchased | Total Tokens | Total Invested | Portfolio Value | Average Cost |
| January 2026 | $100 | $0.6 | 166.67 | 166.67 | $100 | $100 | $0.6 |
| February 2026 | $100 | $0.45 | 222.22 | 388.89 | $200 | $175 | $0.51 |
| March 2026 | $100 | $0.55 | 181.82 | 570.71 | $300 | $314 | $0.53 |
| April 2026 | $100 | $0.5 | 200 | 770.71 | $400 | $385 | $0.52 |
| May 2026 | $100 | $0.7 | 142.86 | 913.57 | $500 | $639 | $0.55 |
Practical schedules vary by personality. Active traders may buy weekly, regular investors often prefer bi-weekly and long-term holders usually choose monthly automation. Many platforms support recurring purchases, which turns investing into a habit rather than a gamble. DCA does not eliminate risk, yet it builds discipline, and discipline matters more than perfect timing.
Frequently Asked Questions
What Is the Cheapest Cryptocurrency to Buy Right Now?
The phrase cheapest cryptocurrency to buy sounds simple, yet price alone misleads investors. A $0.1 token with 100 billion supply can carry a higher valuation than a $10 token with 100 million supply. Market capitalization, not token price, determines real size. Market cap equals price multiplied by circulating supply. That number shows how much value the market assigns to a project.
For example, February 2026 prices show XRP near $1.5, ADA around $0.28, XLM close to $0.17, HBAR near $0.1, and GRT around $0.03. GRT looks cheaper per coin, yet valuation depends on total supply. Investors should ask which project offers the best value, not the lowest sticker price. Prices also change every minute, so live data matters more than static numbers.
Which Crypto Has 1000x Potential?
The question which crypto has 1000x potential reflects lottery-style thinking, yet 1000x returns remain extremely rare. To reach that scale, a project must start as a micro-cap under $10 million and grow into a multi-billion ecosystem. That requires revolutionary technology, perfect timing, and massive adoption. The math alone explains the challenge. A $10M market cap growing to $10B demands global traction.
Historical examples exist. Bitcoin from 2011 to 2017 and Ethereum from 2015 to 2021 produced life-changing returns, but both required years of patience and brutal volatility. In the 2026 cycle, reframing expectations makes more sense. Established projects might deliver 5–10x in strong conditions. Early-stage networks with fundamentals could reach 20–50x. Investors should focus on risk-adjusted returns instead of miracle narratives.
Can Cheap Cryptocurrencies Make You Rich?
Yes, cheap crypto that will explode has created large fortunes before, but survivorship bias hides the failures. Solana rose from $1.5 in 2020 to $260 in 2021. Polygon climbed from $0.01 to $2.9 in the same cycle. These gains look spectacular, yet most cheap tokens never recover. More than 90% of 2017 ICO projects now hold little or no value.
High returns demand early entry, emotional resilience, and strategic profit taking. Crypto regularly produces 80–95% drawdowns, even during bull markets. Many investors sell at the bottom and miss the recovery. 2026 opportunities likely appear in AI, real-world asset tokenization, and Bitcoin Layer 2 ecosystems. However, none represent guaranteed wins. Cheap crypto investing resembles venture capital. A few winners offset many losers.
Which Crypto Coin Will Boom Next?
Predicting the next big crypto coin depends on broader market forces, not a single secret pick. Bitcoin dominance cycles, sector rotation, and narrative momentum shape performance. In 2026, attention grows around AI integration, real-world asset tokenization, restaking protocols, modular blockchains, and Bitcoin Layer 2 networks. Projects like FET, HBAR, and emerging infrastructure chains attract early interest because they align with these themes.
Investors should watch milestone calendars, whale accumulation patterns, and developer activity. GitHub commits, testnet launches, and partnership announcements often signal growth before price reacts. Community discussion on social platforms also reveals early traction. No signal guarantees success, but patterns appear when adoption accelerates.
What Is the Best Crypto to Buy Now?
The question of what crypto should I buy now has no universal answer because “best” depends on risk tolerance and timeframe. Conservative investors usually anchor portfolios around Bitcoin and Ethereum, which provide institutional stability. Moderate growth seekers often add established Layer 1 ecosystems such as SOL, AVAX, or SUI. Aggressive investors allocate small portions toward undervalued infrastructure tokens like GRT, FET, or ARB.
Diversification across categories reduces risk. A balanced February 2026 structure might place 60–70% in large caps, 20–30% in established alts, and no more than 10–20% in speculative positions. This content remains educational, not financial advice. Investors should research independently and consult professionals when necessary.
Are Cheap Cryptocurrencies Riskier than Bitcoin?
Yes. High risk high reward crypto assets carry substantially more danger than Bitcoin. Bitcoin volatility often ranges between 40–60% annually, while cheap altcoins can exceed 80–200%. Bear markets frequently produce 50–90% drawdowns in small caps. Liquidity also differs sharply. Bitcoin trades tens of billions daily, while smaller projects may handle only millions, which increases slippage and exit difficulty.
Scam rates remain higher among new tokens, and many projects fail completely. Bitcoin benefits from institutional ETFs, regulatory clarity, and deep infrastructure. Cheap cryptocurrencies lack that safety net and also face smart contract risks that can drain funds. These assets behave like speculative venture bets. Most portfolios should cap exposure at 10–20% of crypto holdings, or roughly 2% of total investments.
Conclusion
The best cheap cryptos attract investors because they lower the entry barrier and offer asymmetric upside. Small allocations can sometimes produce 10–100x returns, yet the same volatility creates real danger. The 2026 environment still rewards discipline more than excitement. Cheap crypto should never mean blind speculation. Strong decisions start with research focused on fundamentals, use cases, and ecosystem growth instead of hype cycles.
Diversification remains essential. Investors should spread exposure across sectors such as Layer 1 networks, infrastructure, AI, and DeFi rather than betting everything on one token. Secure purchasing also matters. Non-custodial platforms like StealthEX reduce custody risk and keep control in the user’s wallet. Strategies like DCA and careful position sizing help manage emotional swings. No investment should exceed what an investor can afford to lose completely.
Beginners benefit from starting small, often in the $50–200 range, while continuing education about blockchain technology and tokenomics. Monitoring 2026 catalysts such as halving cycle effects and regulatory shifts helps maintain context. Opportunities exist, but discipline separates long-term participants from short-term gamblers. This content serves educational purposes only, not financial advice. Cryptocurrency investing carries the risk of total loss.

Follow us on Medium, X, Telegram, YouTube, and Publish0x to stay updated about the latest news on StealthEX.io and the rest of the crypto world.
Don’t forget to do your own research before buying any crypto. The views and opinions expressed in this article are solely those of the author.
ADA best crypto cheap crypto XLM XRPThe post Best Cheap Crypto to Buy Now in 2026 first appeared on StealthEX.]]>